.glowing-wrapper-glow-outer {
position: absolute;
top: -8px;
left: -8px;
width: calc(100% + 16px);
height: calc(100% + 16px);
border-radius: 999px;
background: radial-gradient(
85% 120% at 50% 120%,
rgba(255, 255, 255, 0.3) 0%,
rgba(255, 255, 255, 0) 100%
);
pointer-events: none;
opacity: 0;
transition: opacity 0.8s ease;
z-index: 0; /* Keep it behind the button */
}
/* Make glow appear when hovering the button */
.glowing-wrapper-button:hover ~ .glowing-wrapper-glow-outer {
opacity: 0.8;
}
.glowing-wrapper-button {
box-shadow:
rgba(0, 0, 0, 0.4) 0px 4px 3px -1px, /* drop shadow */
rgba(255, 255, 255, 0.22) 0px 1px 1px 0px inset; /* inner light */
}
/* Ensure predictable stacking inside the wrapper */
.glowing-wrapper { position: relative; }
.glowing-wrapper-animations,
.glowing-wrapper-borders-masker,
.glowing-wrapper-glow-outer { z-index: 0; }
/* --- Button depth (drop + inner shadows) --- */
.glowing-wrapper-button {
position: relative; /* create a stacking context */
z-index: 1; /* above the animation layers */
border: 1.5px solid #000;
border-radius: 50px;
background-color: rgb(44,44,44);
/* DROP SHADOW (like your .link-block) */
box-shadow: rgba(0,0,0,0.4) 0px 4px 3px -1px;
}
/* INNER SHADOW / TOP HIGHLIGHT lives on a pseudo-element so it won't hit icons */
.glowing-wrapper-button::before {
content: "";
position: absolute;
inset: 0;
border-radius: inherit;
pointer-events: none;
/* INNER LIGHT (same as .link-block) */
box-shadow: rgba(255,255,255,0.22) 0px 1px 1px 0px inset;
}
/* Hover state to match your second button */
.glowing-wrapper-button:hover {
background-color: rgb(73,73,73);
box-shadow: rgba(0,0,0,0.2) 0px 4px 3px -1px;
}
.glowing-wrapper-button:hover::before {
box-shadow: rgba(255,255,255,0.22) 0px 1px 0px 0px inset;
}
Back home

EandoX
EandoX is an Environmental Product Performance (EPP) software platform that helps companies manage their product sustainability data and meet environmental compliance requirements. It supports Life Cycle Assessments (LCA), Environmental Product Declarations (EPD), CSRD, and CBAM reporting.
Role
Founding Product Designer
Category
Climate tech
Team
6 people
Timeline
Dec 2024 - August 2025
The platform enables users to:
- Collect sustainability data by combining manual input with automation and integrations.
- Measure and manage product-level environmental data in a scalable way.
- Report with consistent and auditable outputs that meet regulatory and market needs.
- Reduce environmental impact by acting on insights within connected supply chain data.
The platform is designed to be scalable, connected, and straightforward. It grows with data demands, brings in supplier information in real time, and makes reporting easier through familiar tools such as spreadsheets. Out of the box, it meets EU regulations, simplifies CBAM requirements, supports eco-design processes, and can generate verified EPDs almost instantly.
1. Introduction
My role was to help EandoX take the idea from vision to reality. I translated complex sustainability and compliance requirements into a product that felt clear, approachable, and scalable. This involved shaping the UX/UI for both the software and the marketing site. I also built a design system to support future growth, created prototypes and animation guidelines to show functionality, and worked closely with developers so the solution remained practical and user-friendly.
2. The Challenge
EandoX set out to solve a pressing issue in sustainability reporting. Companies face rising regulatory demands such as CSRD and CBAM, yet their environmental data is often fragmented, inconsistent, and spread across suppliers, spreadsheets, and internal systems. This made it difficult to produce accurate Life Cycle Assessments (LCA) and Environmental Product Declarations (EPD), and nearly impossible to scale processes as product portfolios and supply chains grew.
The main challenges were:
- Collecting and structuring sustainability data from multiple disconnected sources.
- Simplifying compliance workflows while ensuring outputs remained consistent and auditable.
- Bridging the gap between supplier data and company reporting in real time.
- Designing a platform that could scale without losing usability.
3. Responsabilities
As the sole designer on the core team, I led the product design from concept to launch and owned the entire design process. I was responsible for shaping both the EandoX software platform and the marketing website, ensuring that the product experience and brand presence were consistent and aligned.
I developed the visual identity and defined the art direction for the brand, then built a scalable design system from scratch using the atomic design methodology. This system provided the foundation for rapid iteration and long-term consistency. To bring the product to life, I created UI animations and marketing videos with Rive, and I experimented with AI tools such as Cursor, V0, and Lovable to accelerate prototyping.
Beyond design exploration, I shipped React components using Cursor, Figma MCP, Mantine V7, and Storybook, working closely with developers to ensure a seamless handoff. I also conducted user testing sessions, analysed research findings, and continuously refined the platform based on user feedback.
Alongside the product work, I created custom iconography, illustrations, and marketing assets to strengthen the brand. Throughout the project I collaborated directly with stakeholders, developers, and the marketing team, ensuring design was fully integrated into both the product strategy and the company’s wider goals.
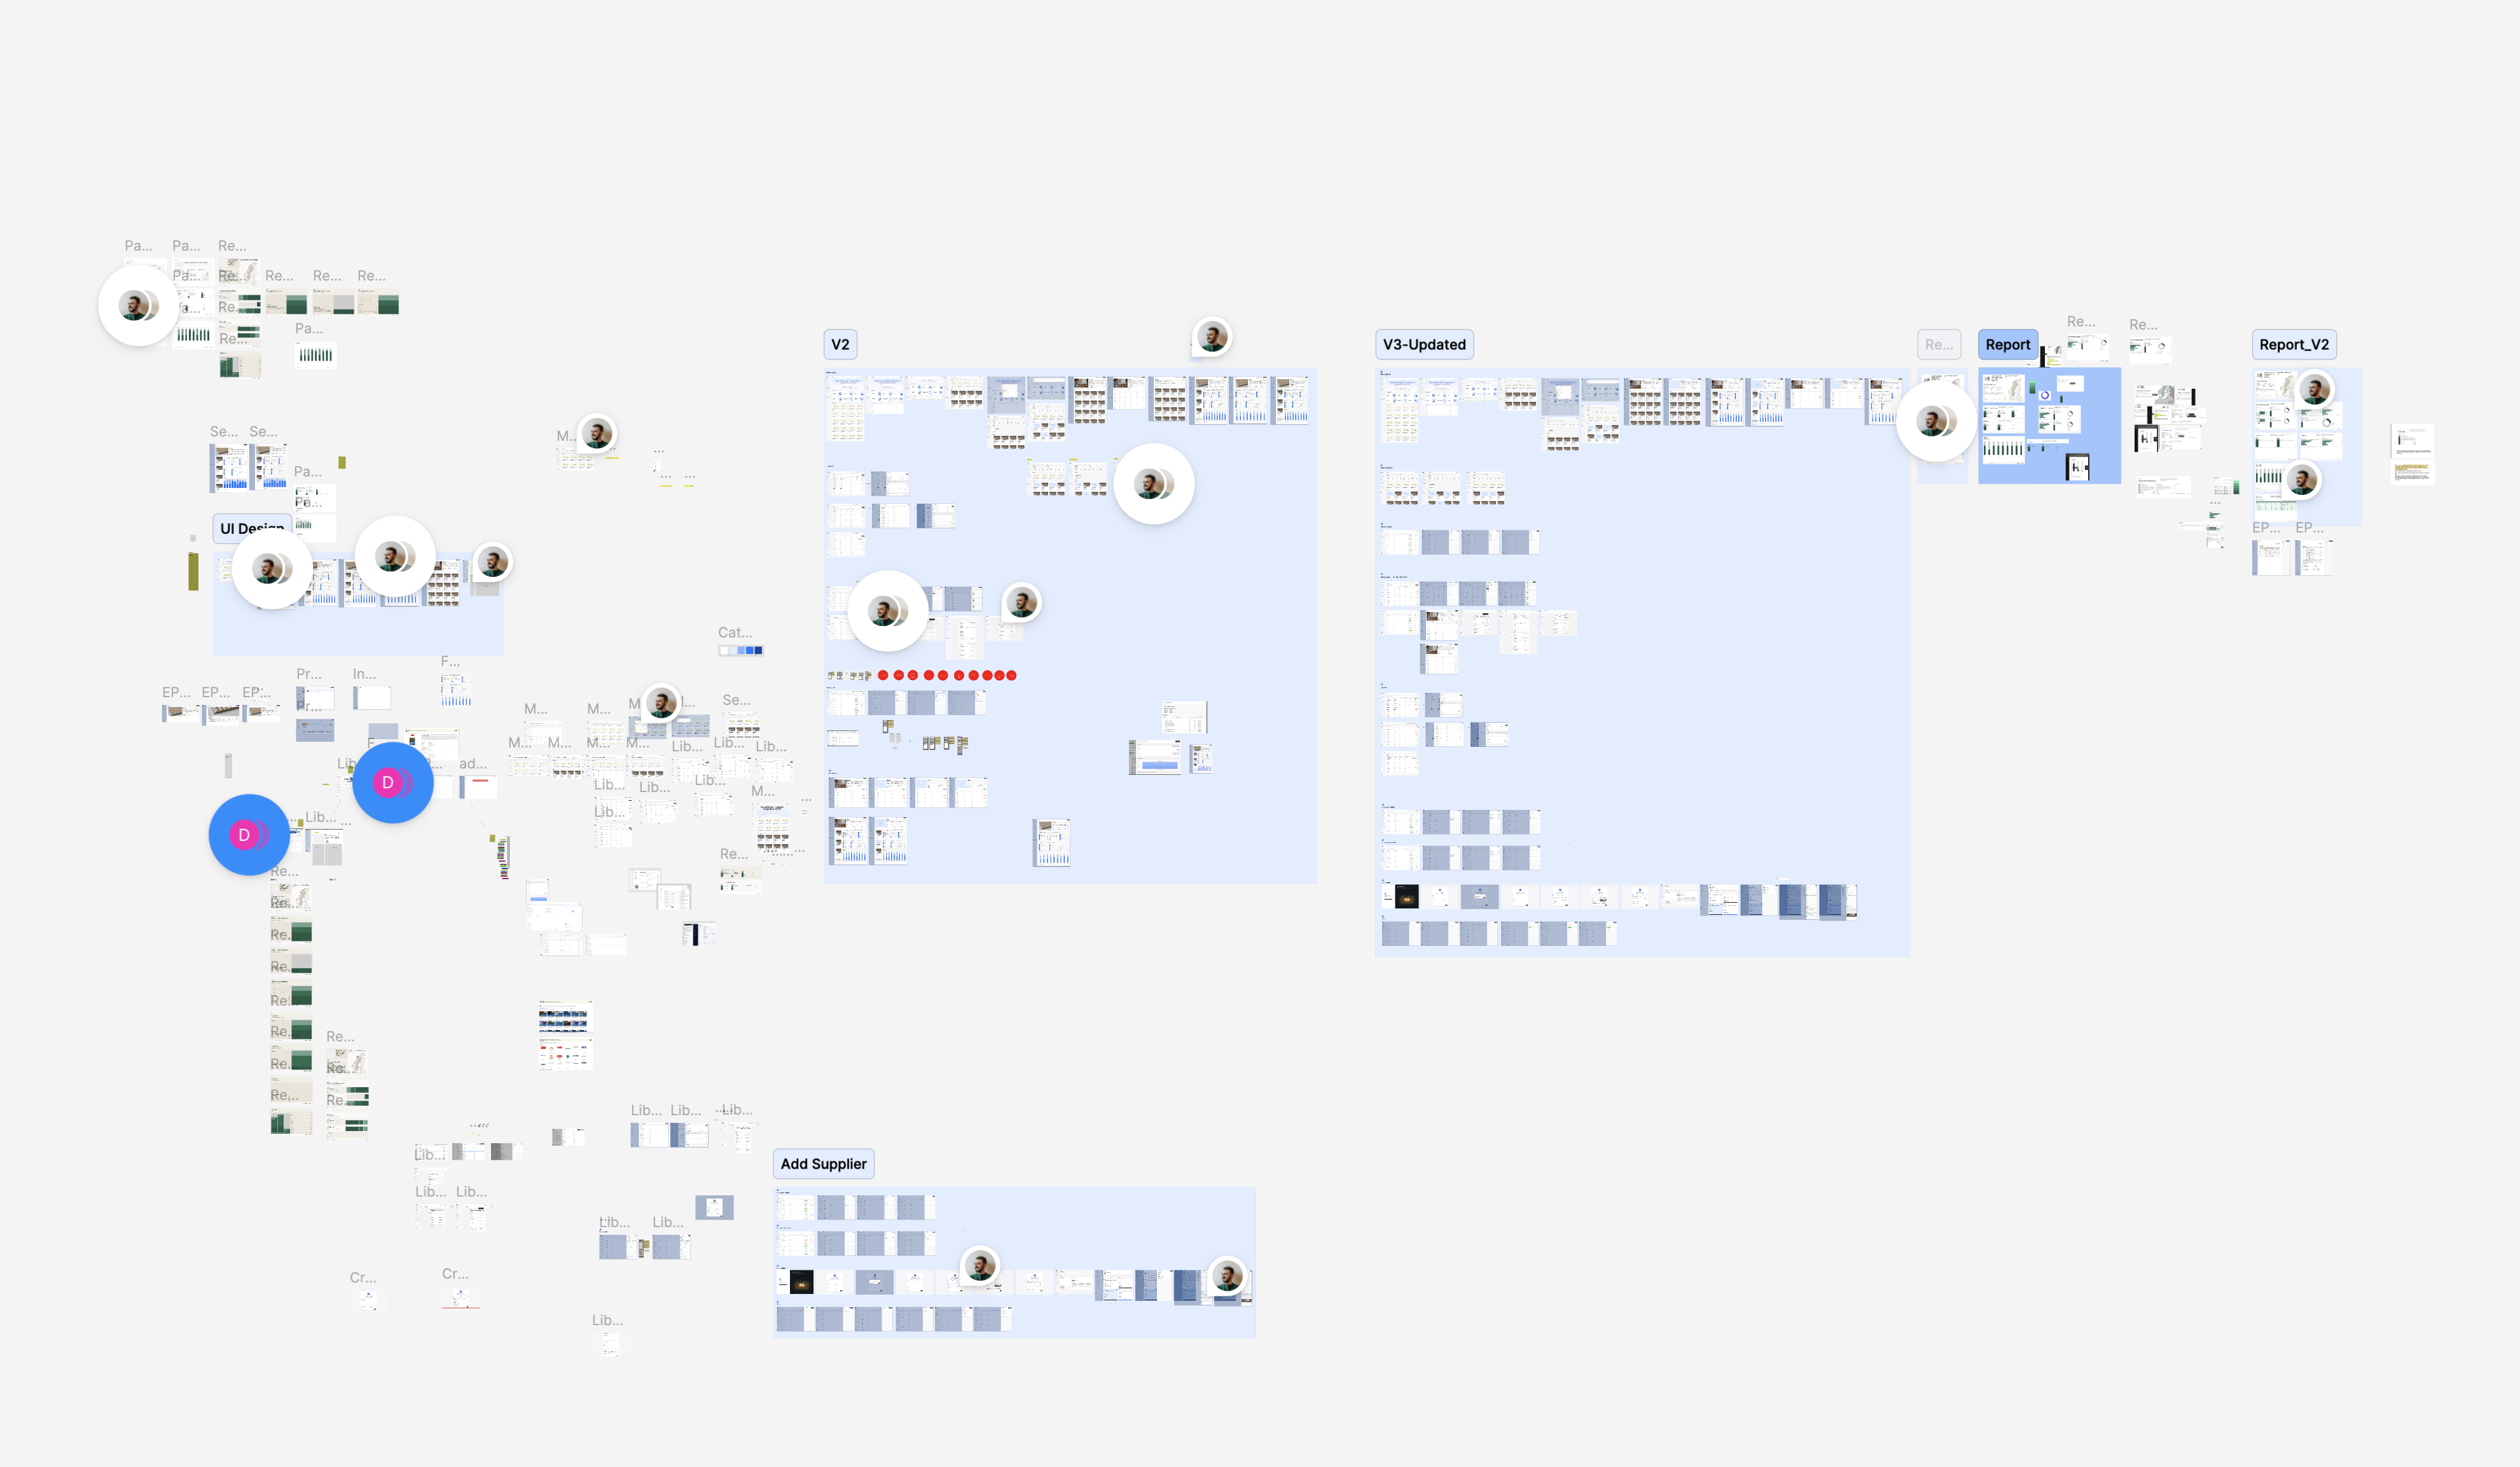
4. Process
I began the project by immersing myself in the software already developed by the engineering team. I identified areas for improvement and worked closely with the founder to gain a clear understanding of EandoX’s vision and goals.
The next step was to conduct market research within EandoX’s domain and in adjacent industries. This helped me understand how competitors and related sectors approached sustainability reporting, identify common pain points, and spot opportunities to differentiate. The insights from this research informed both the product design and the positioning of the platform in the market.
Main findings
Fragmented workflows: Most companies still rely on spreadsheets and manual processes to manage sustainability data, which creates errors and slows down compliance reporting.
High entry barriers: Existing tools in the sustainability space are often too technical or designed for specialists, making them inaccessible for smaller teams or non-experts.
Rising regulatory pressure: EU regulations like CSRD and CBAM were creating urgency, but many businesses lacked the tools to meet these requirements efficiently.
Lack of scalability
Companies with growing product portfolios and complex supply chains found it difficult to scale their reporting systems without losing accuracy or consistency.
Companies with growing product portfolios and complex supply chains found it difficult to scale their reporting systems without losing accuracy or consistency.
Disconnection from suppliers: Gathering data from suppliers was one of the biggest pain points, since existing platforms offered little support for collaboration or real-time data sharing.
Missed opportunities for brand value: Sustainability reporting was seen as a compliance task rather than a chance to create transparency, trust, and differentiation in the market.
Design system
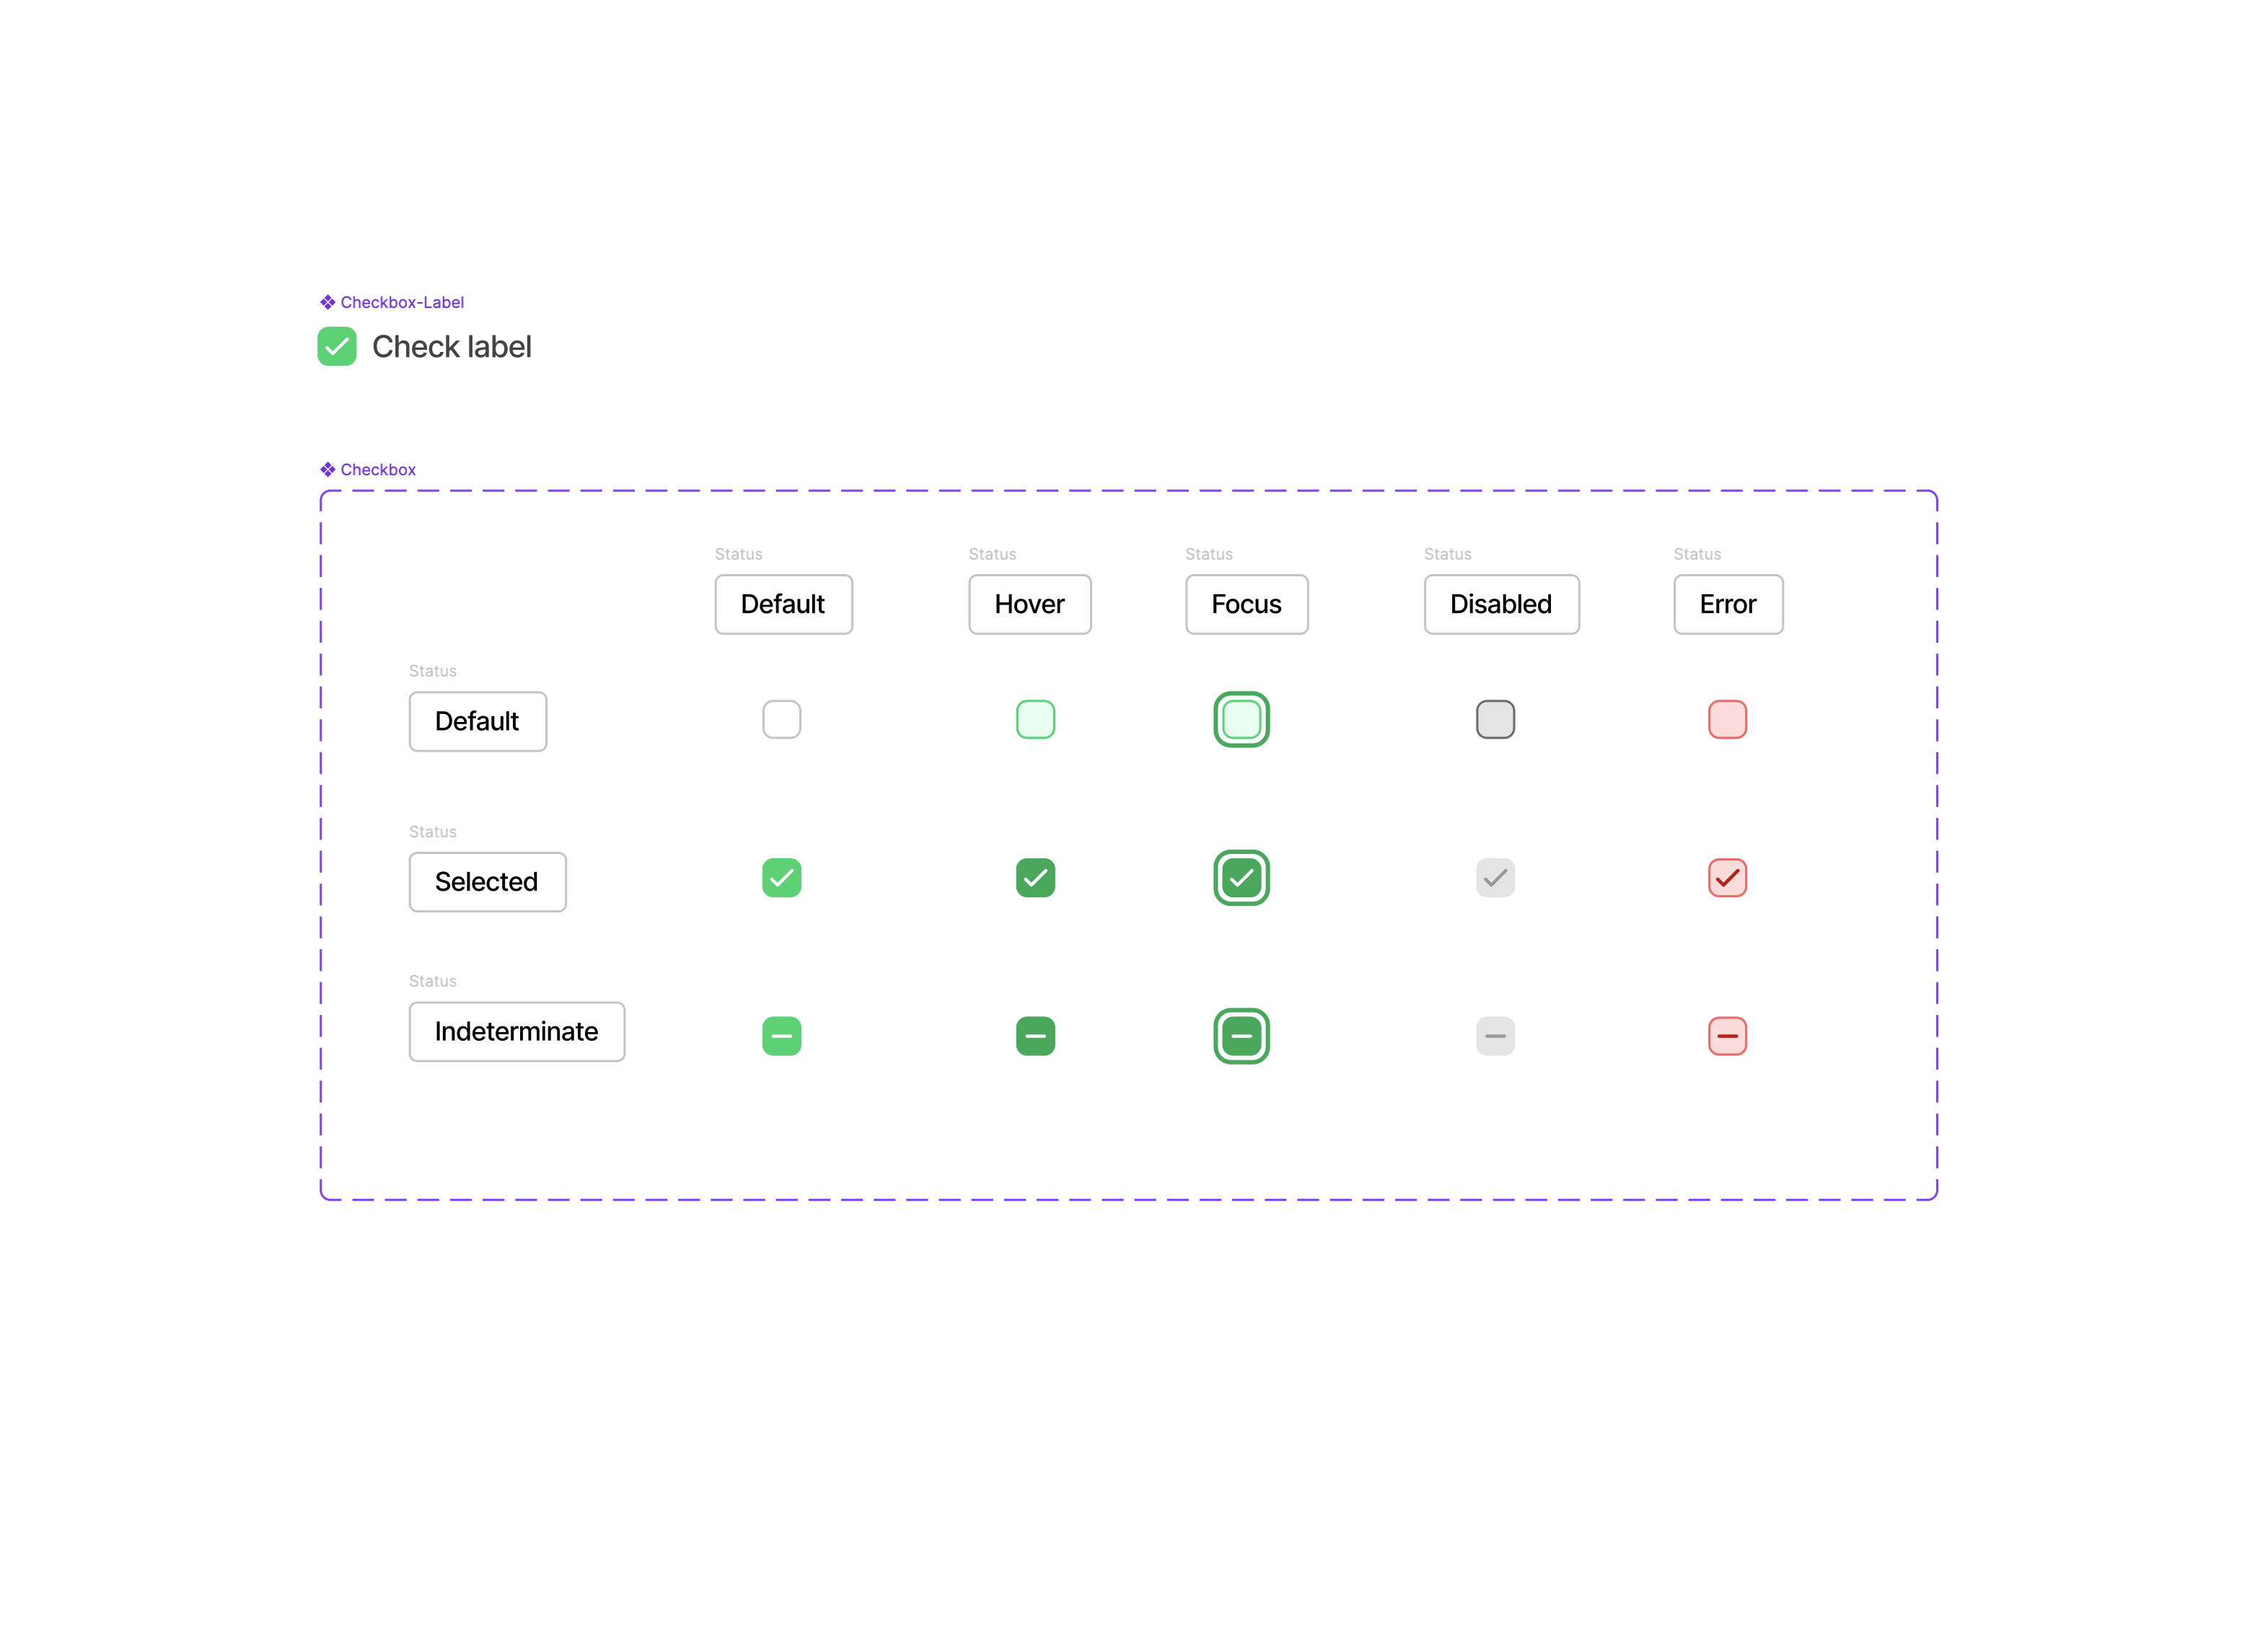
I began by redesigning individual interface elements that were already in use on the platform. As patterns started to emerge, I transitioned this work into a structured design system. Once I had enough atomic elements defined, I built out reusable atomic components to support scalability and consistency.
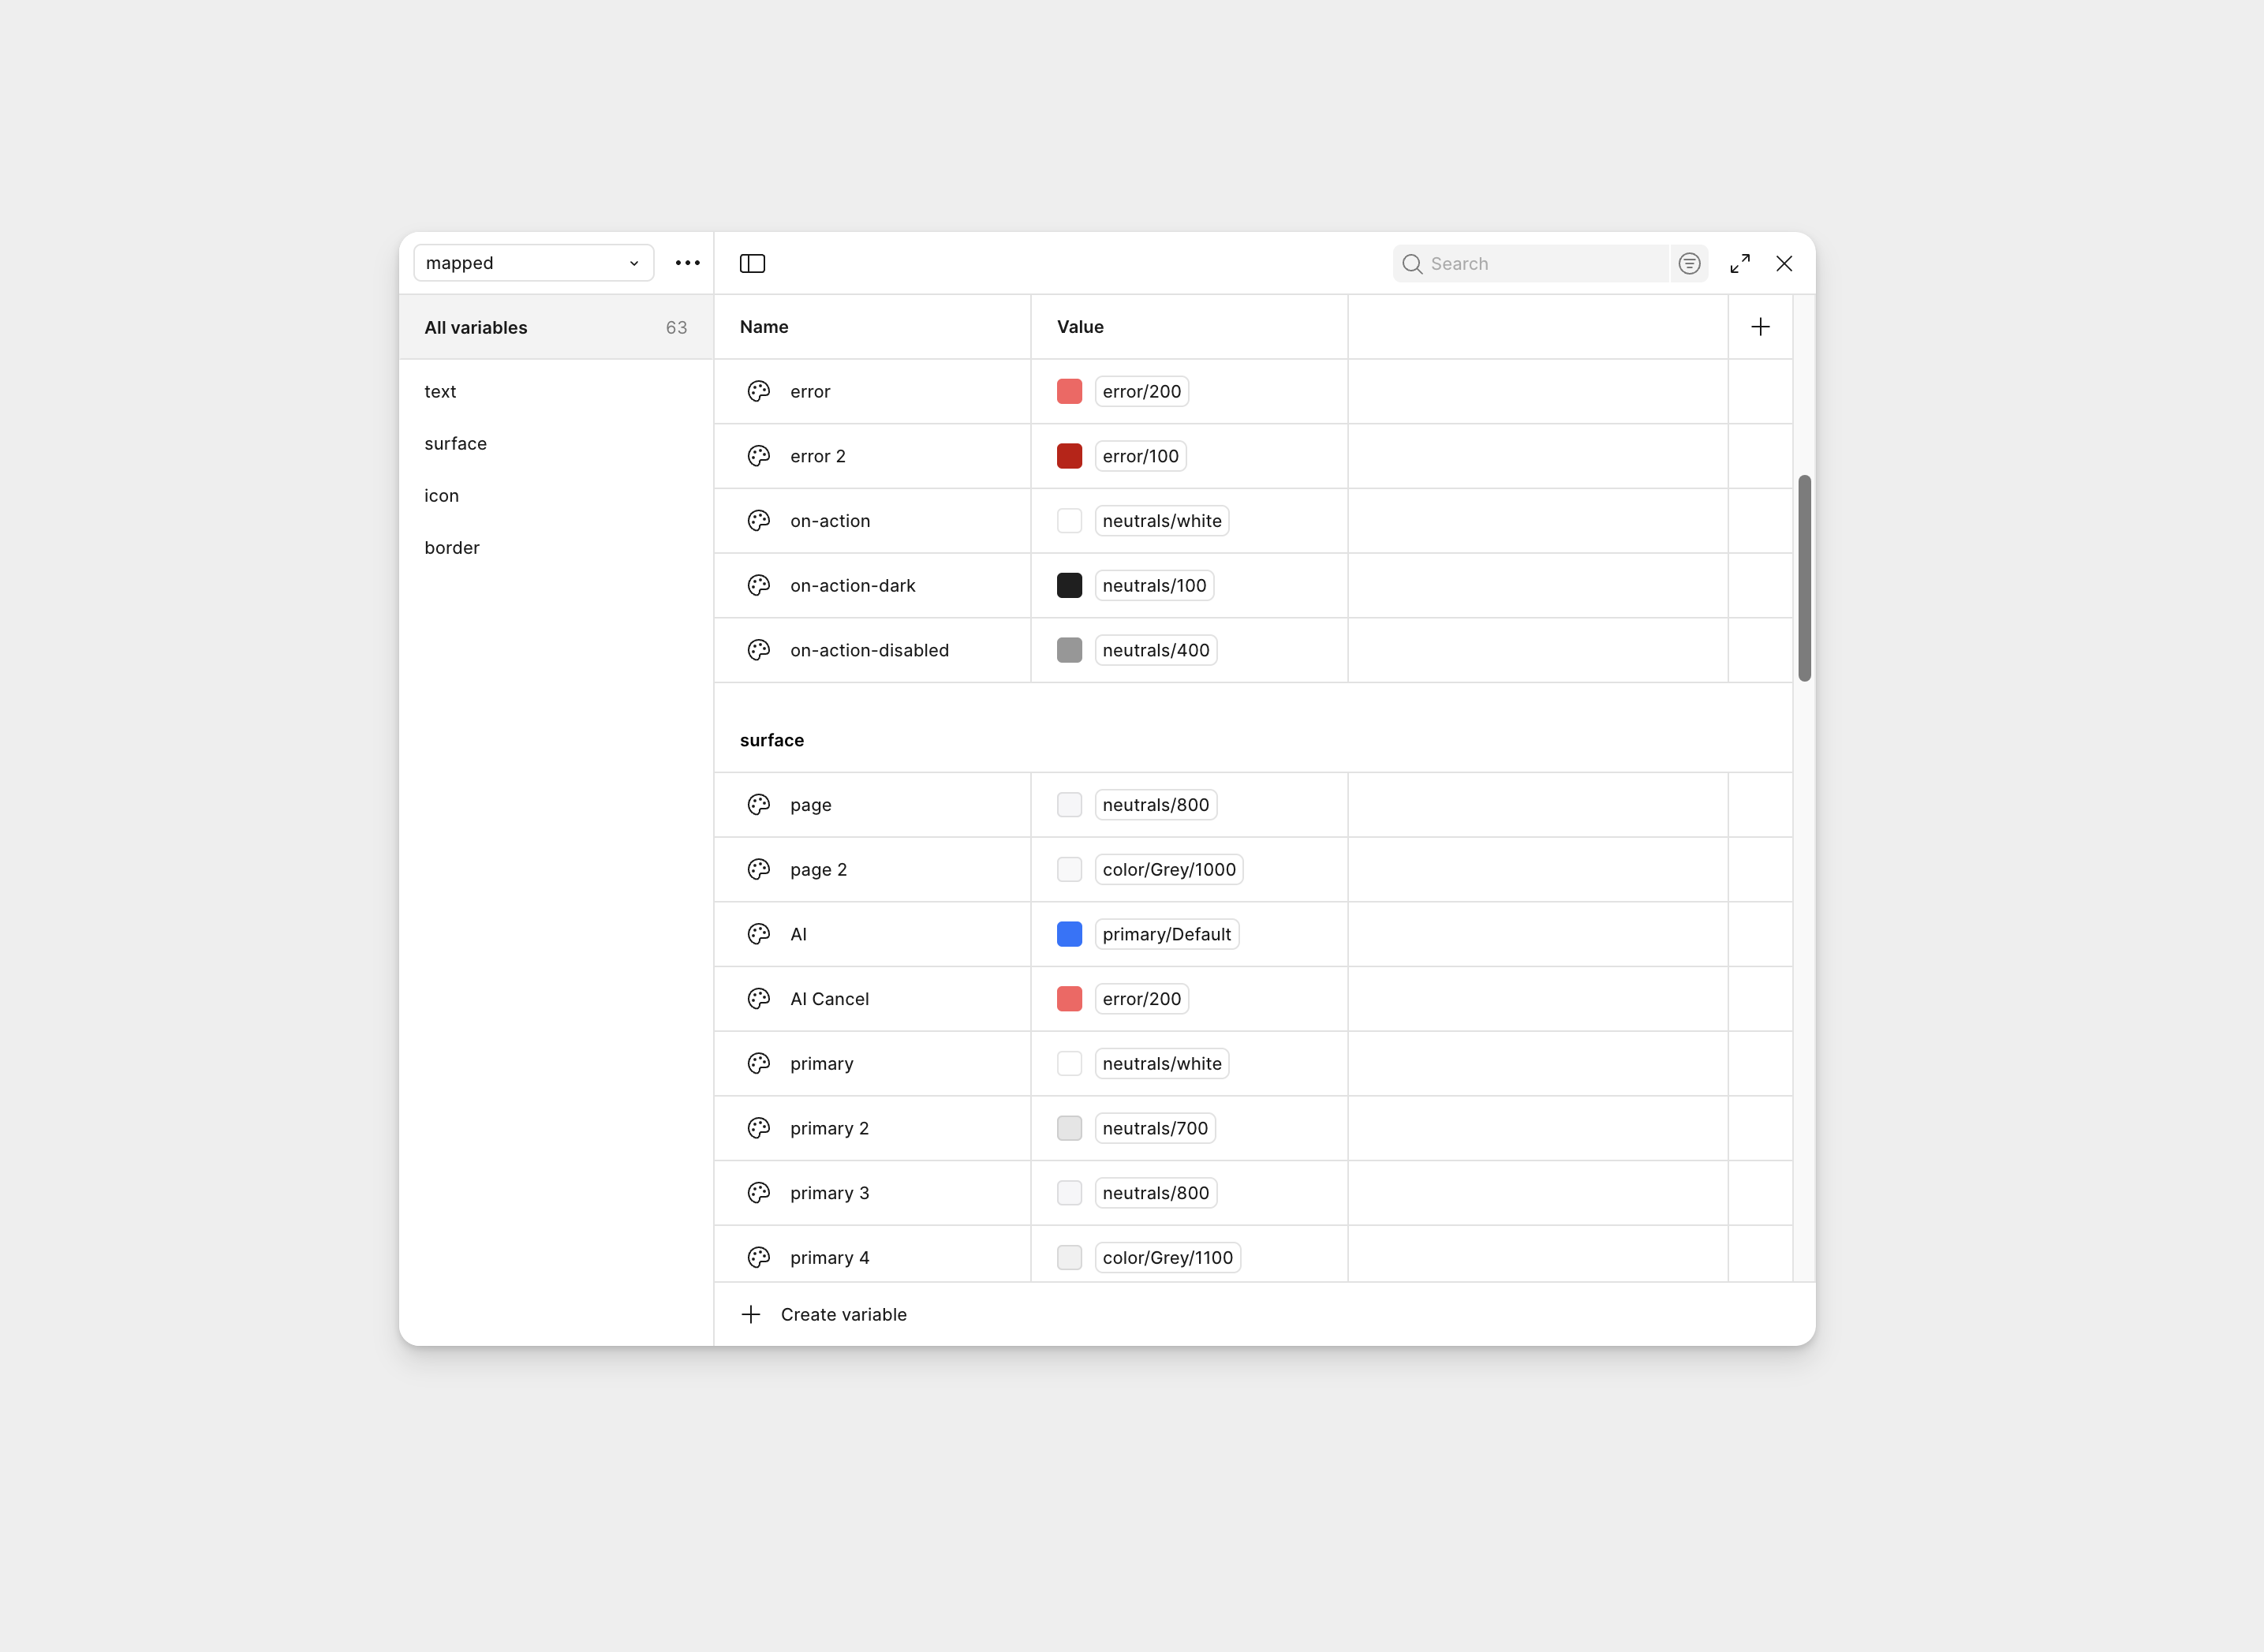
To ensure flexibility, I created a robust set of variables inside Figma, mapping them to different states such as error, action, disabled, and surface layers. Each variable was linked to semantic tokens, which allowed colors and states to be updated globally without breaking consistency across the platform.
The design system was structured according to the atomic design methodology, starting with tokens and atoms (typography, spacing, color variables, icons), then building molecules and organisms (form fields, navigation, cards). This hierarchy enabled faster iteration, a smoother developer handoff, and predictable scalability as the product grew.
By grounding the system in variables and semantic mappings, I ensured that both the design and development teams could maintain visual coherence while adapting to evolving requirements.
Figma tokens
Checkbox
Early exploration
Prototype and testing: Integrating AI
When the core platform was nearly complete, the CEO introduced a new requirement: integrate AI across the product. This opened a new design challenge, since the AI needed to fit seamlessly into existing workflows while adding real value for users.
I began by exploring several directions for how AI could be integrated:
- A global AI mode, where the platform would switch into an AI-driven state.
- A conversational chat assistant, offering contextual help and suggestions.
- Inline AI interactions, inspired by tools like Lovable and V0, where users could select elements directly on the screen and apply AI actions.
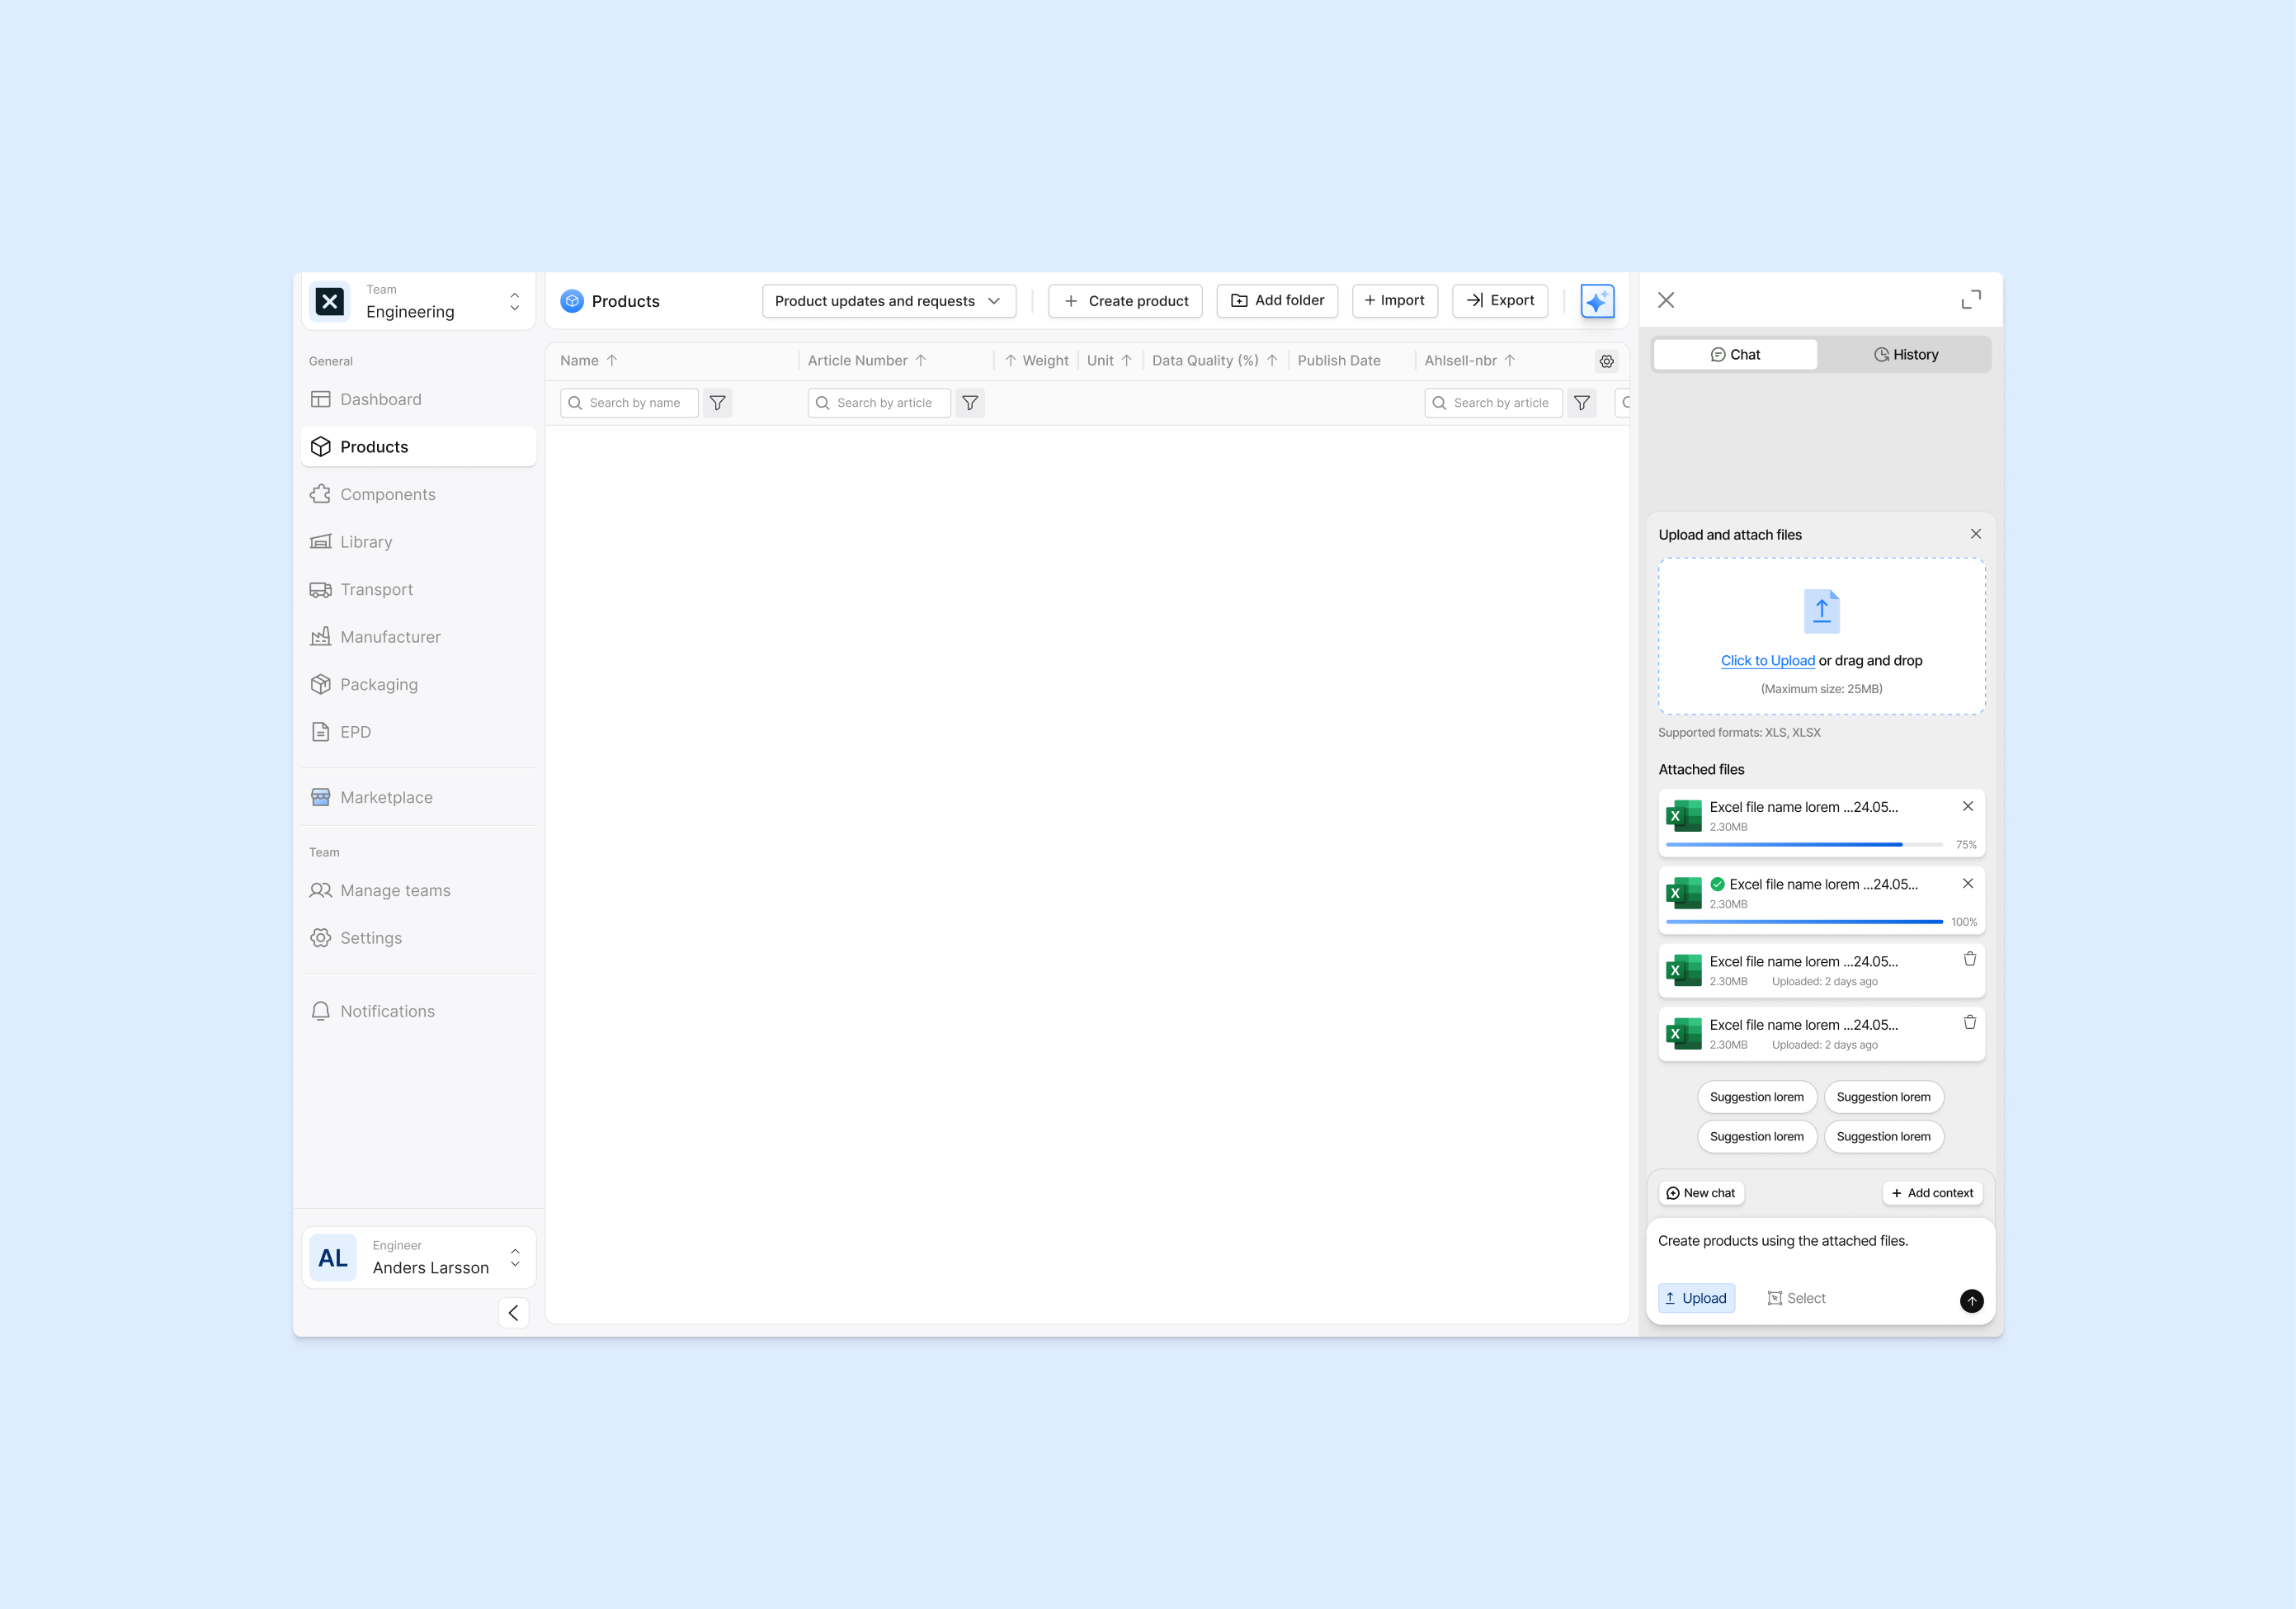
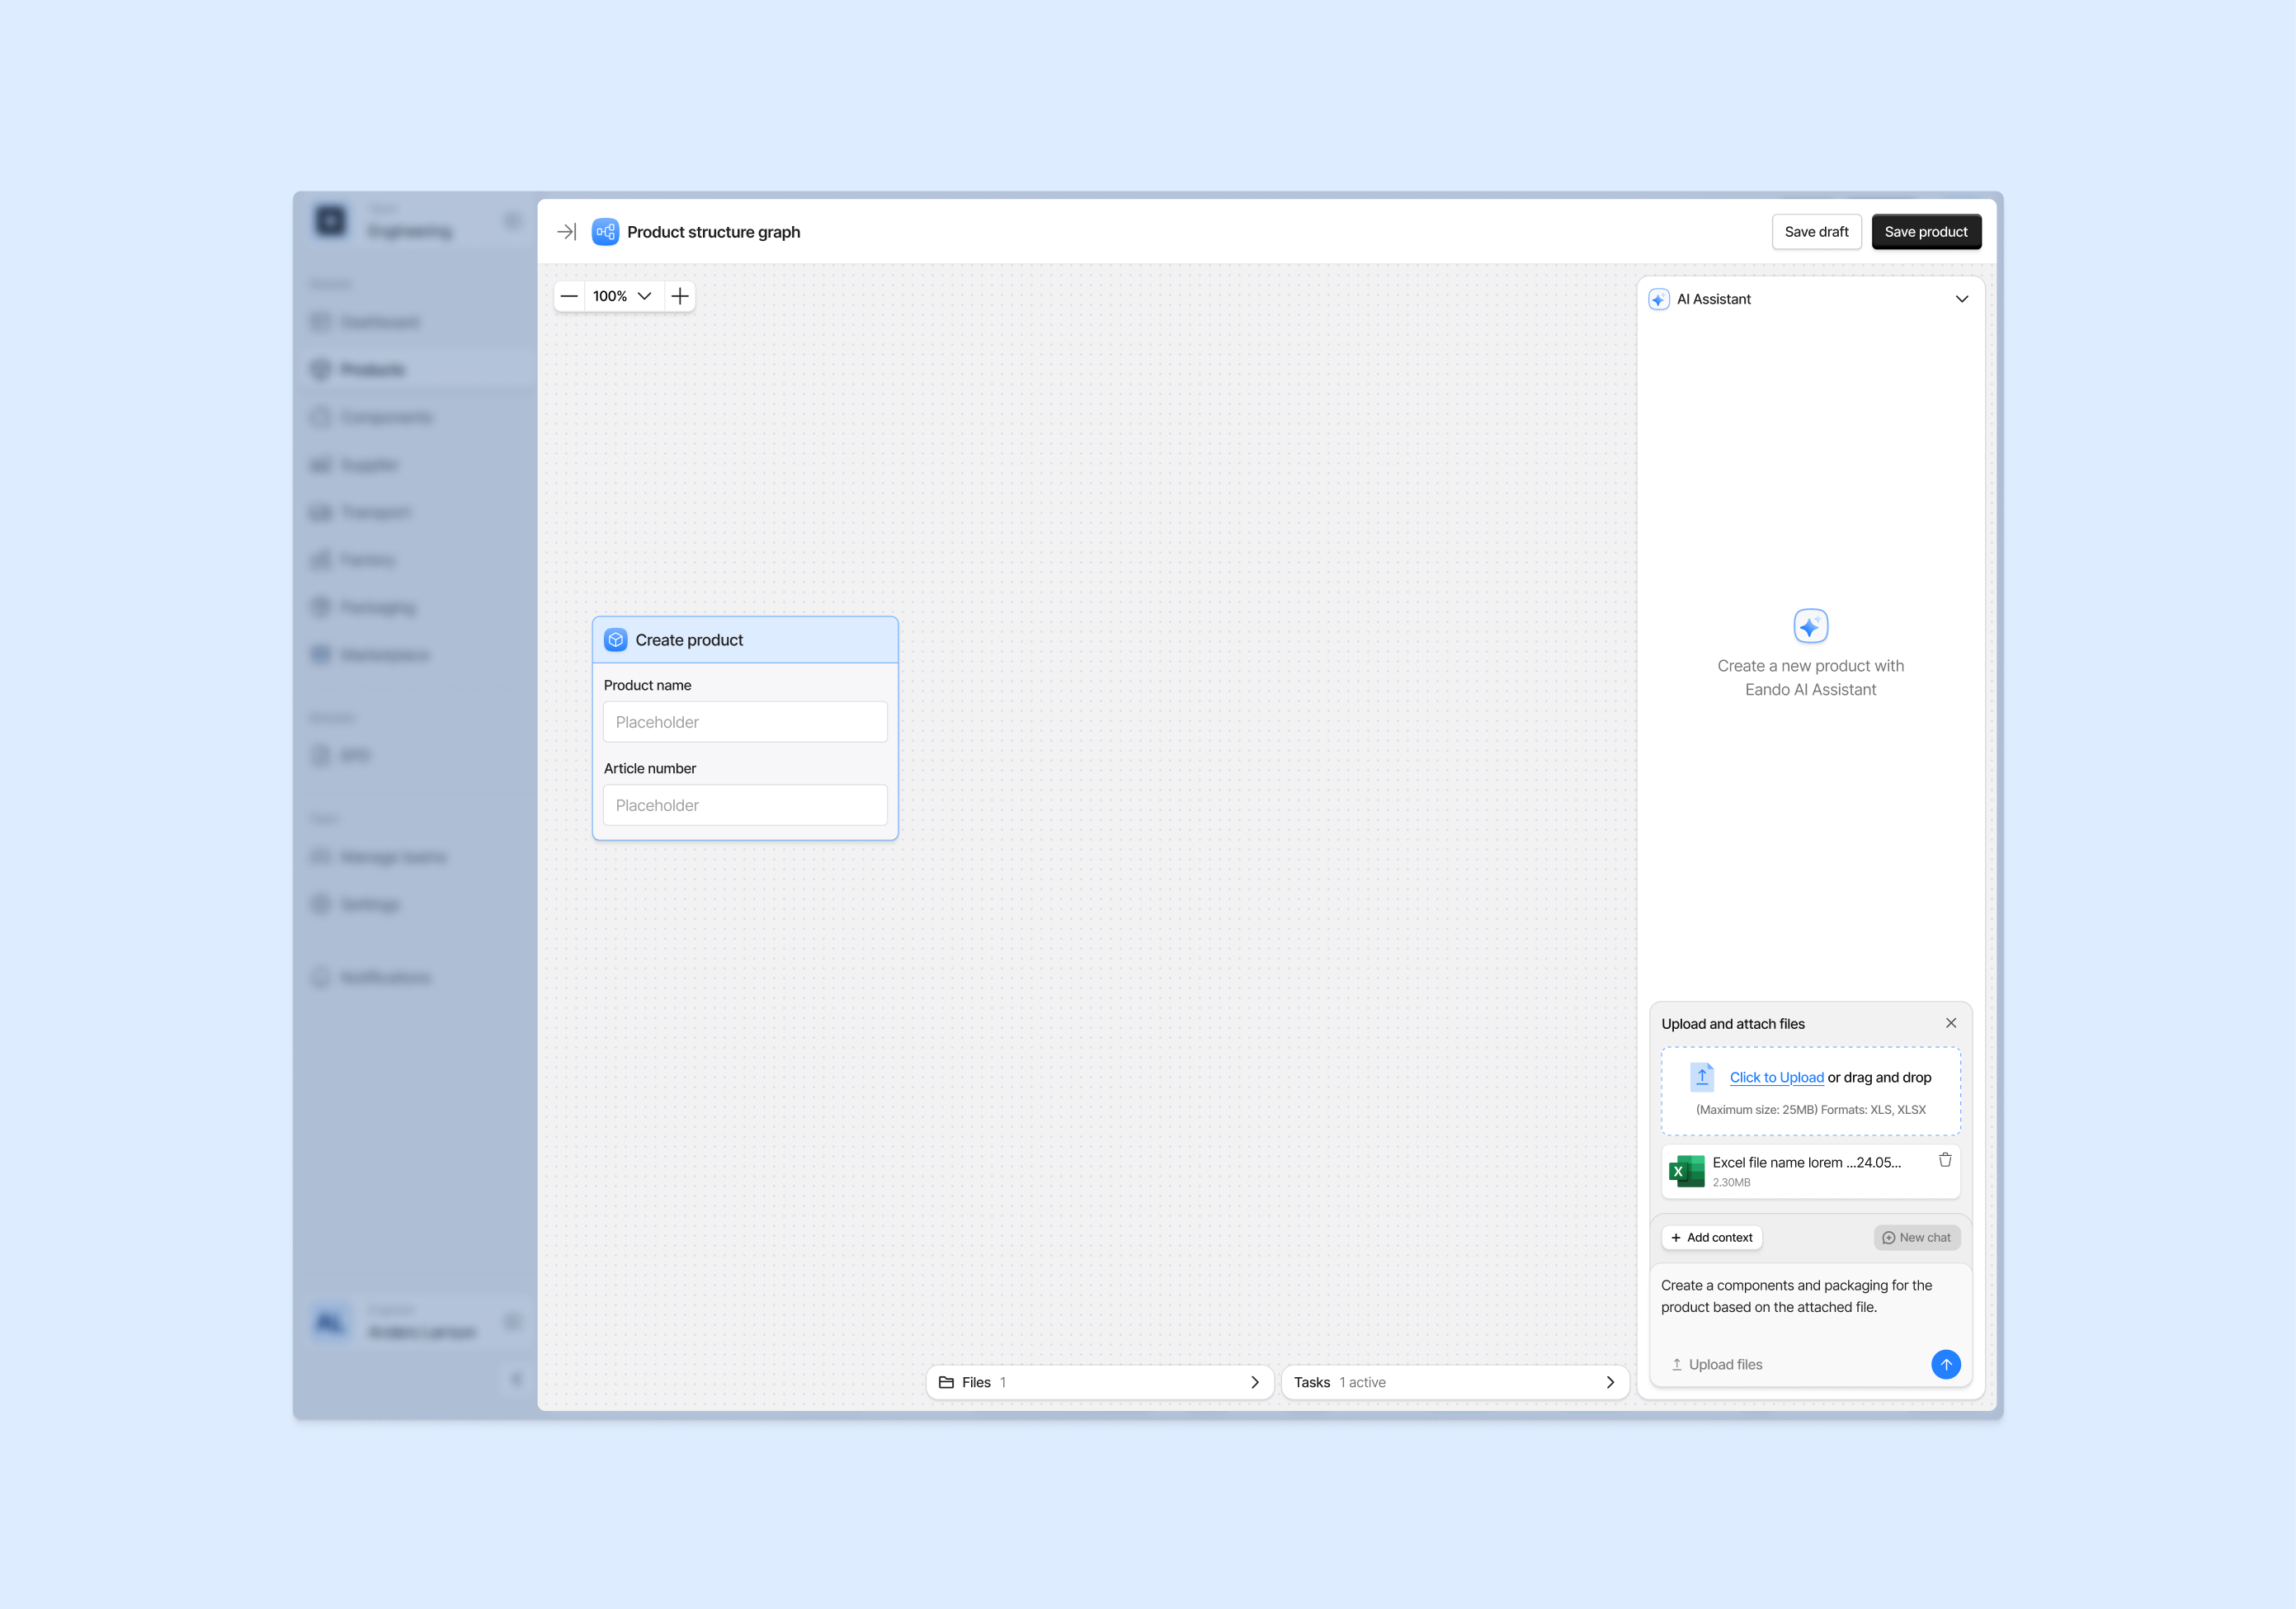
Through prototyping and testing, I evaluated how these modes could support real user tasks. The AI was used for uploading files, creating products, adding context, updating existing items, and allowing users to accept or deny AI-generated changes.
Creating a product with AI - V1
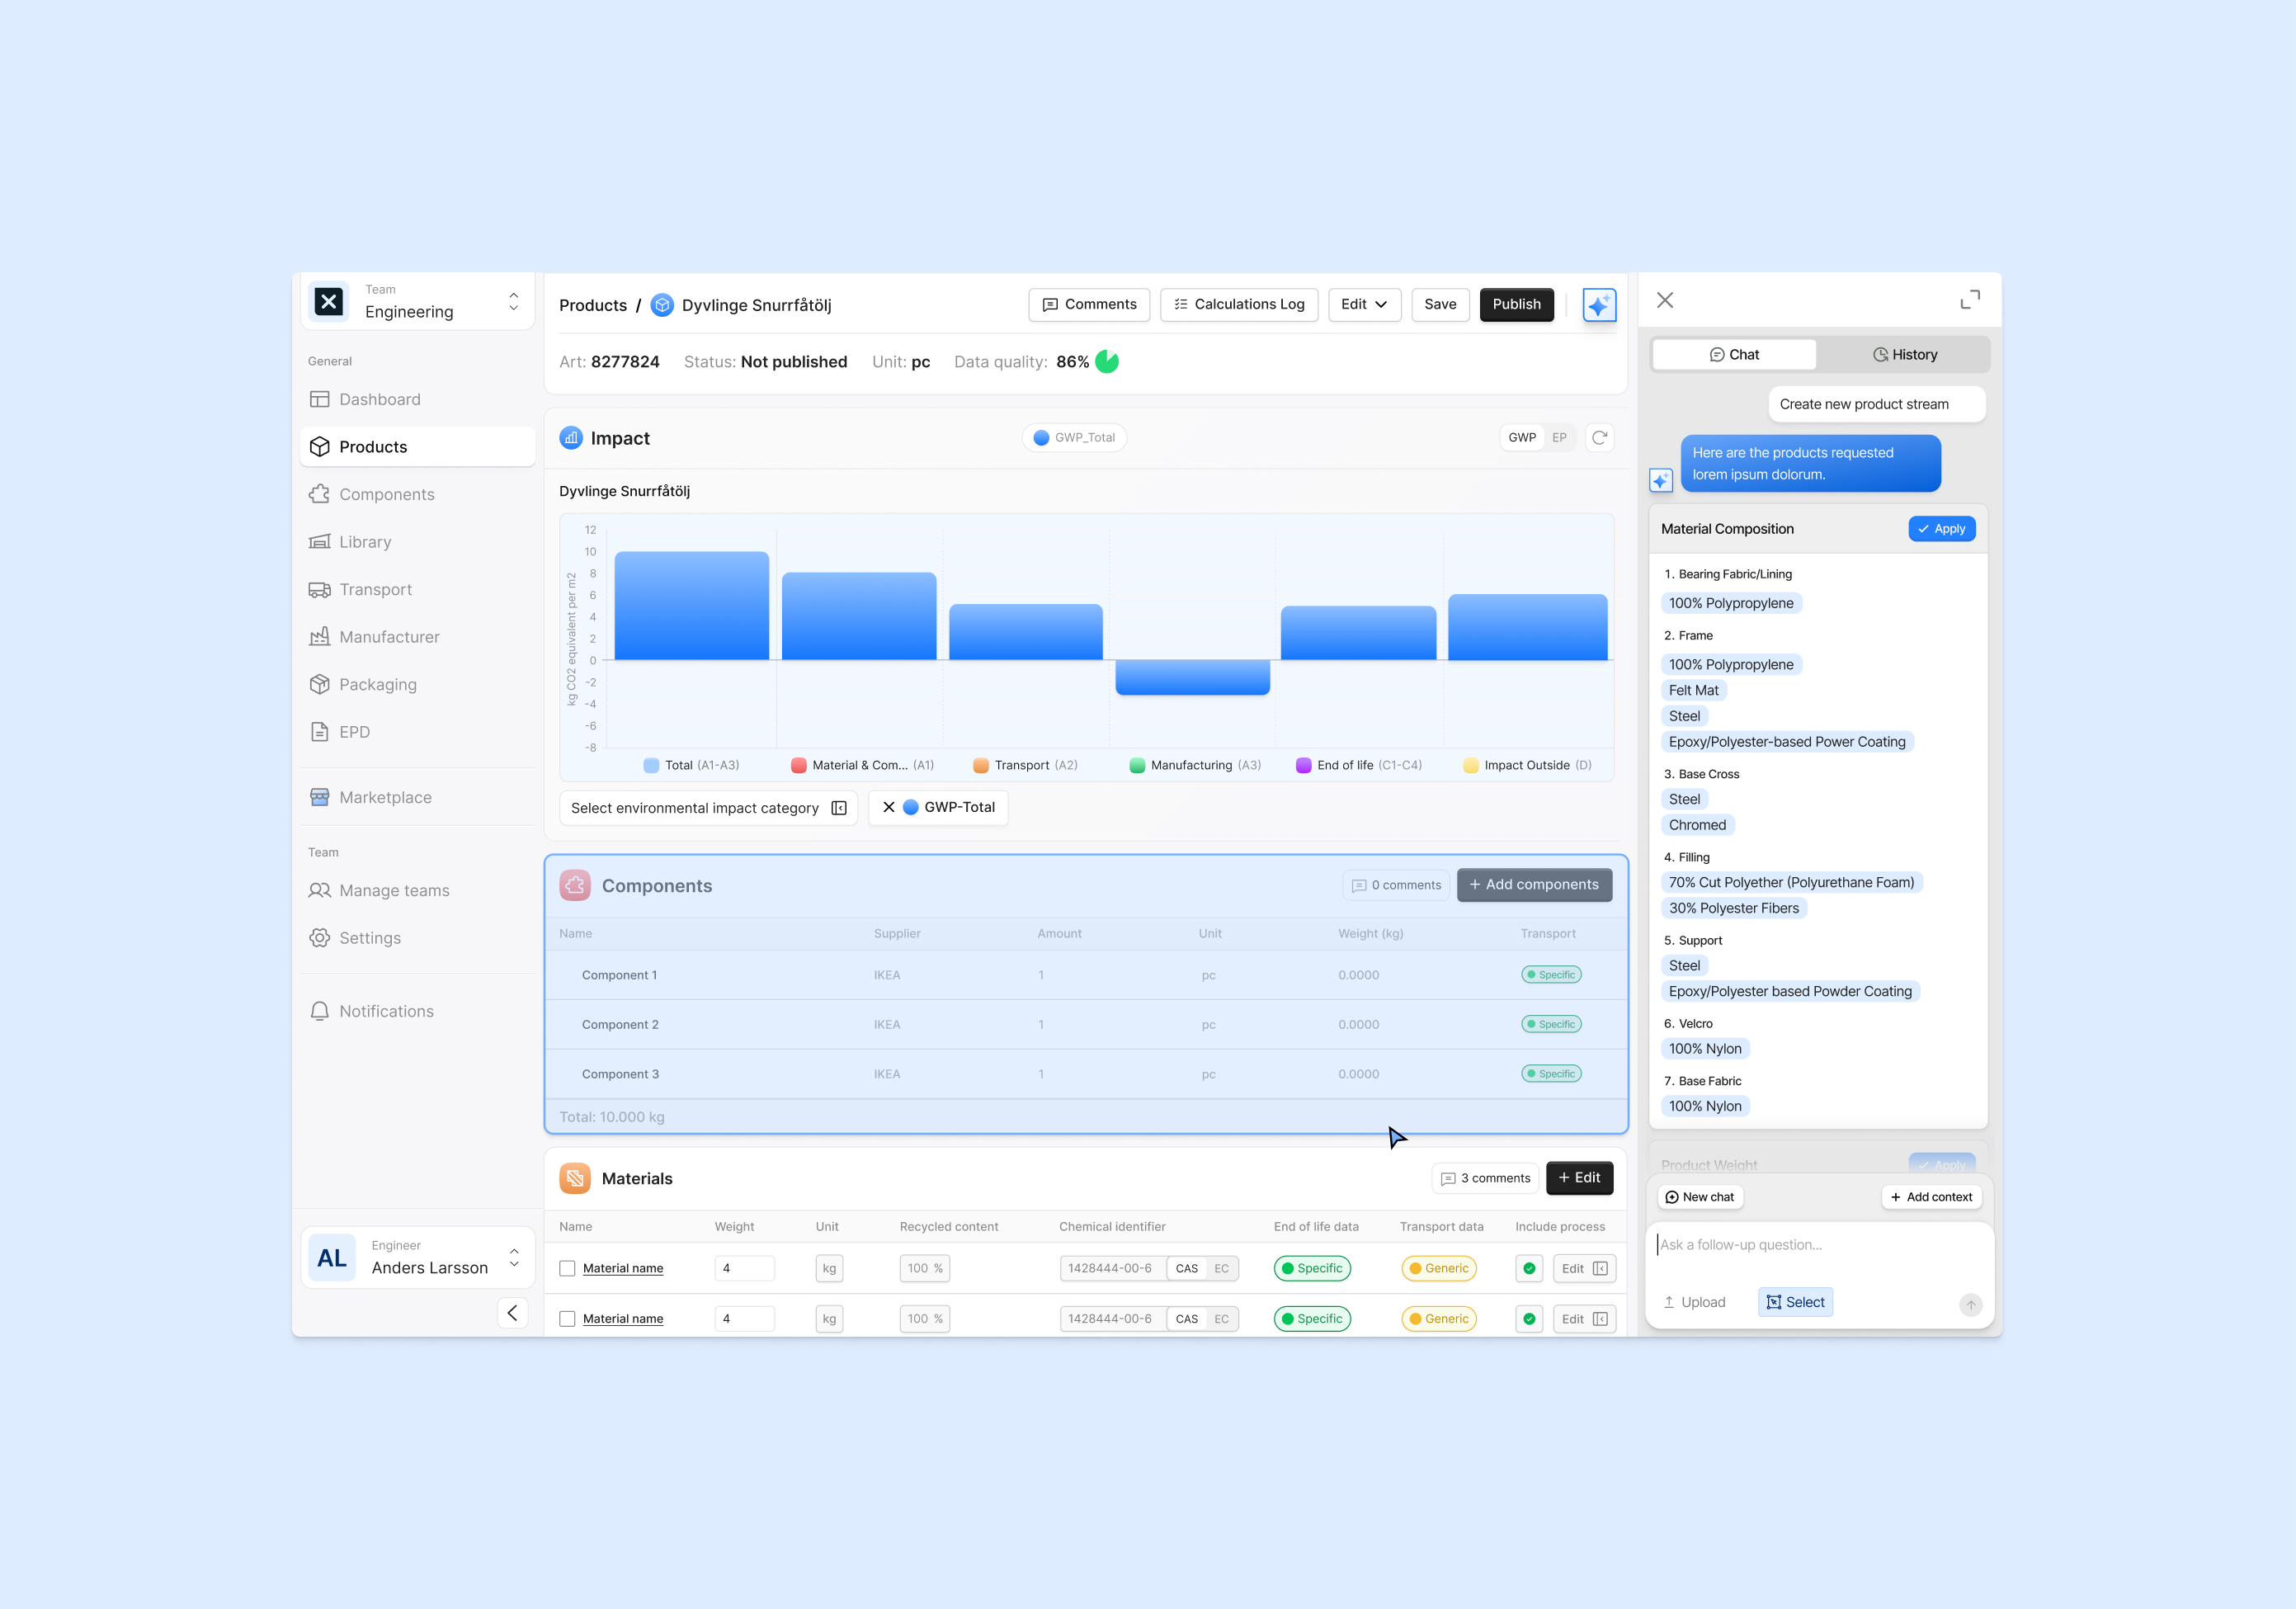
Add to context with select
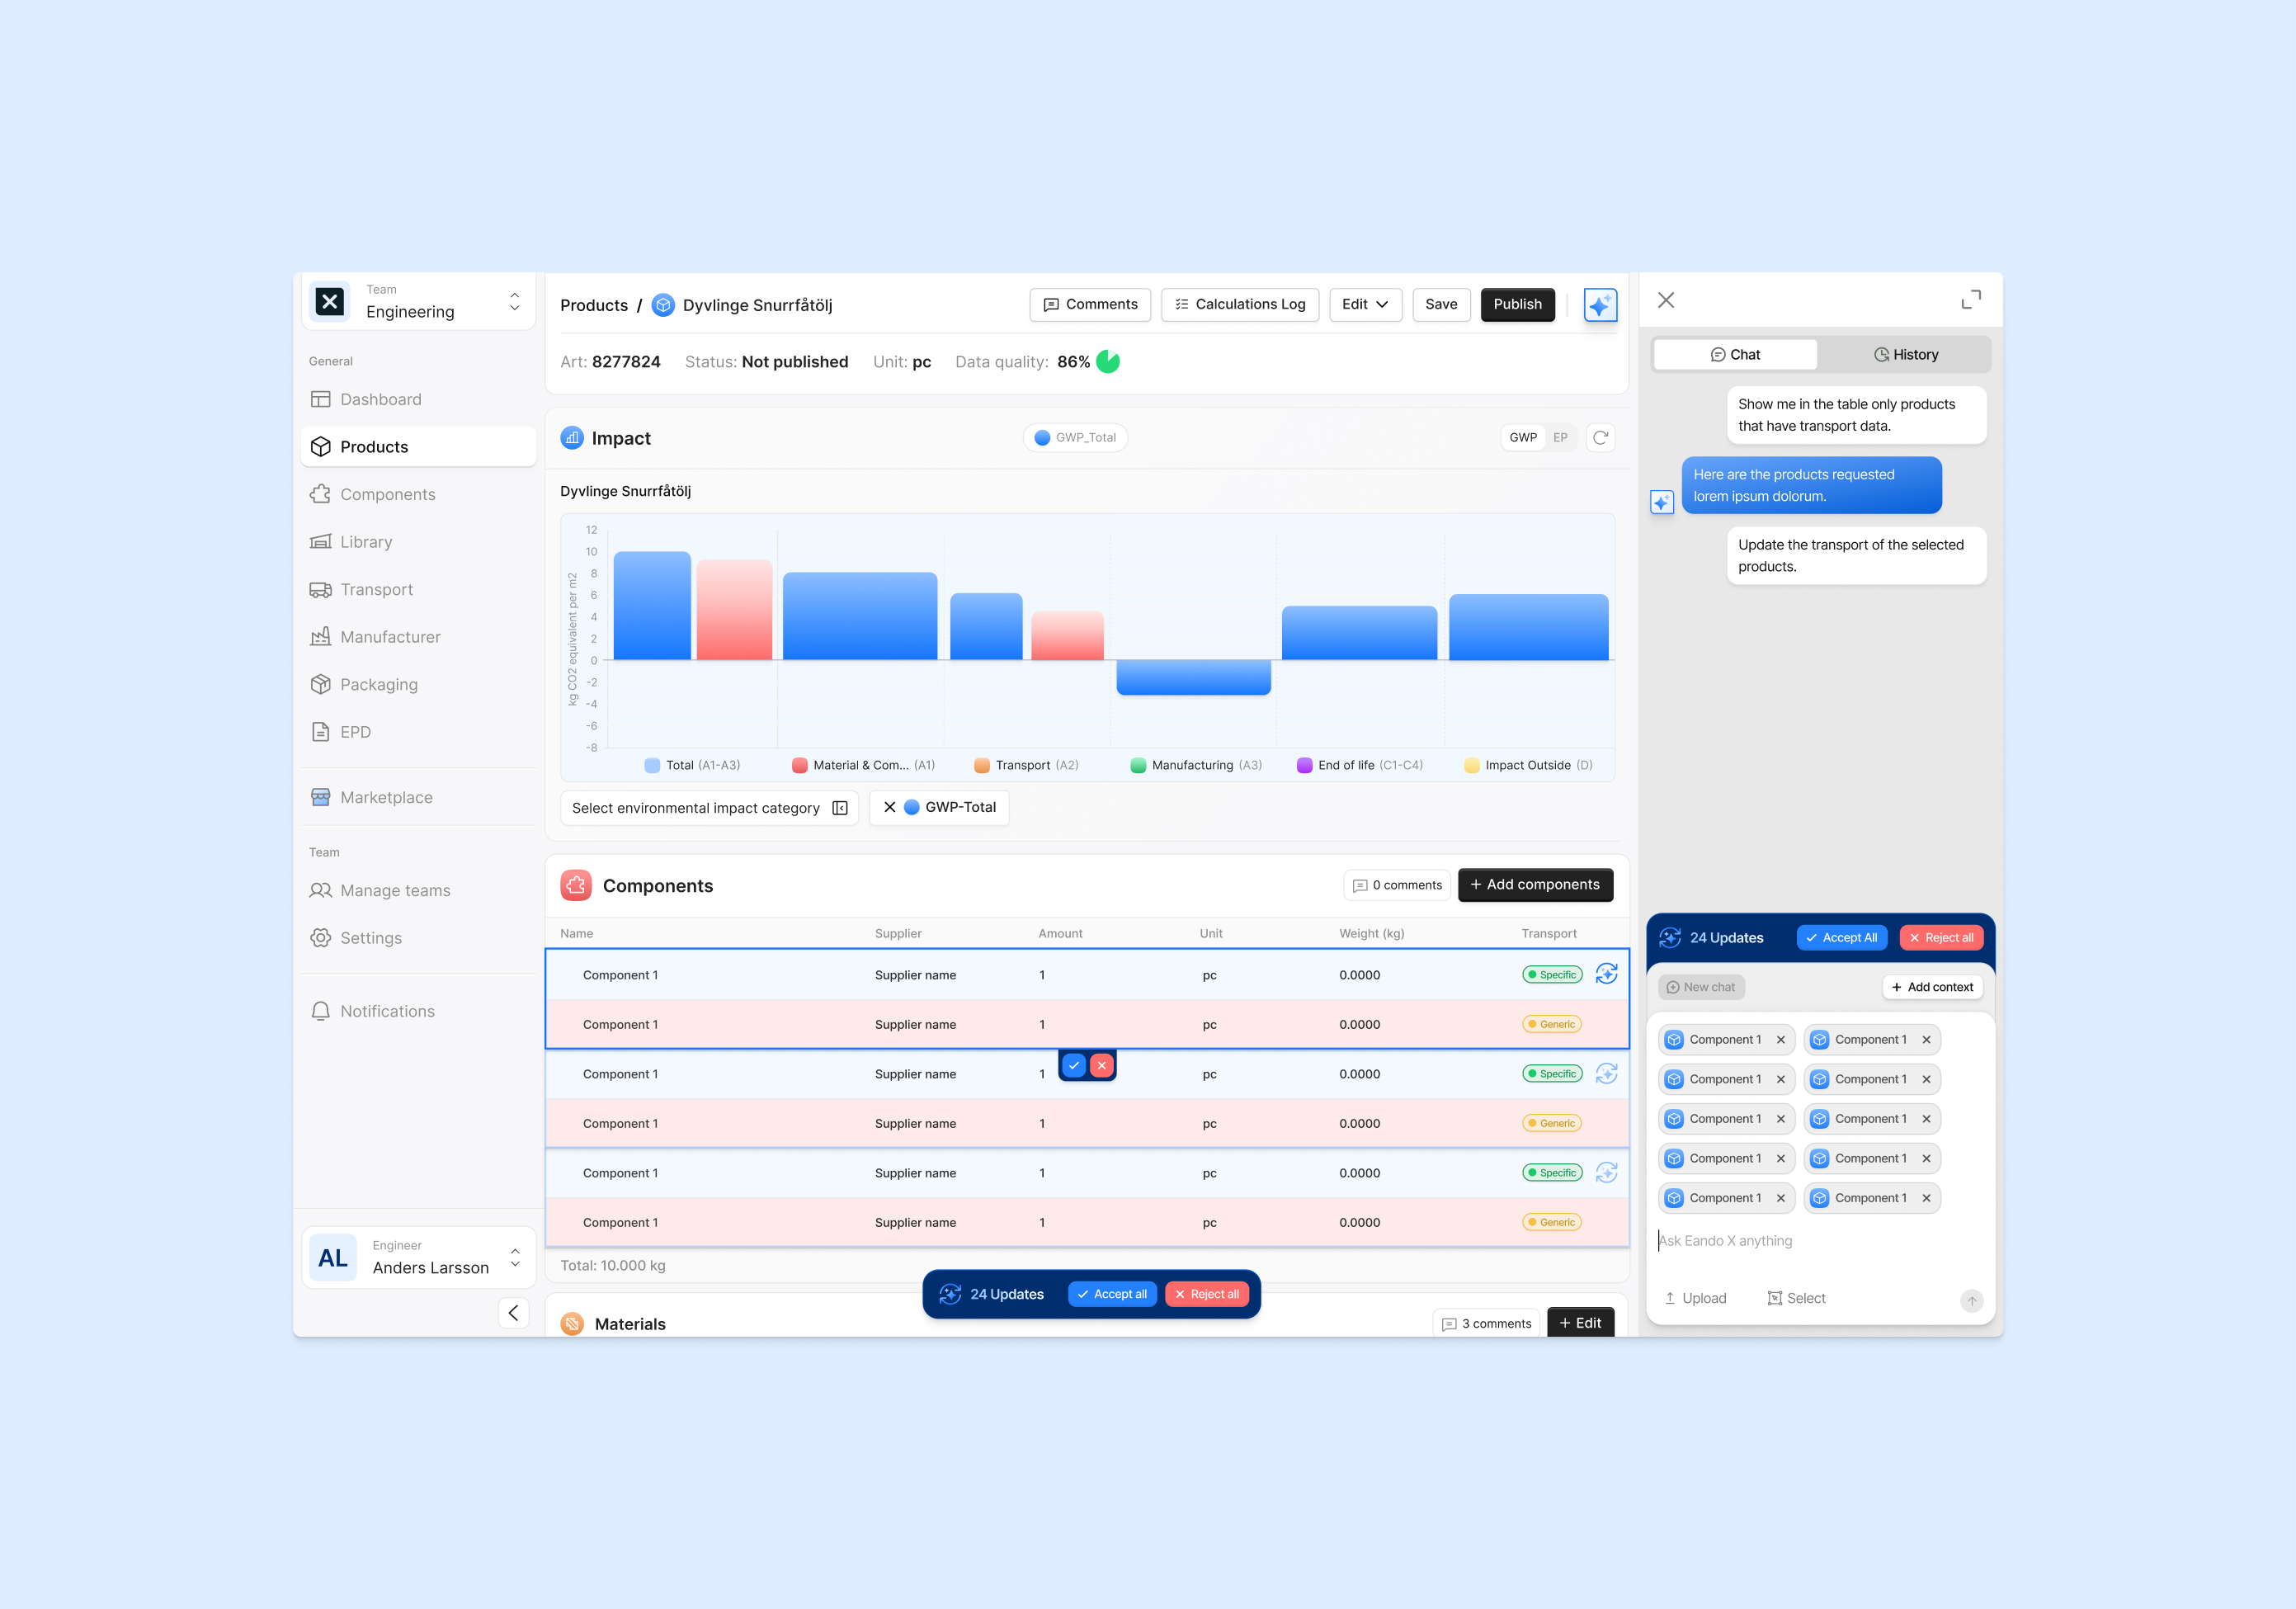
Accept AI changes
Early Demo Build
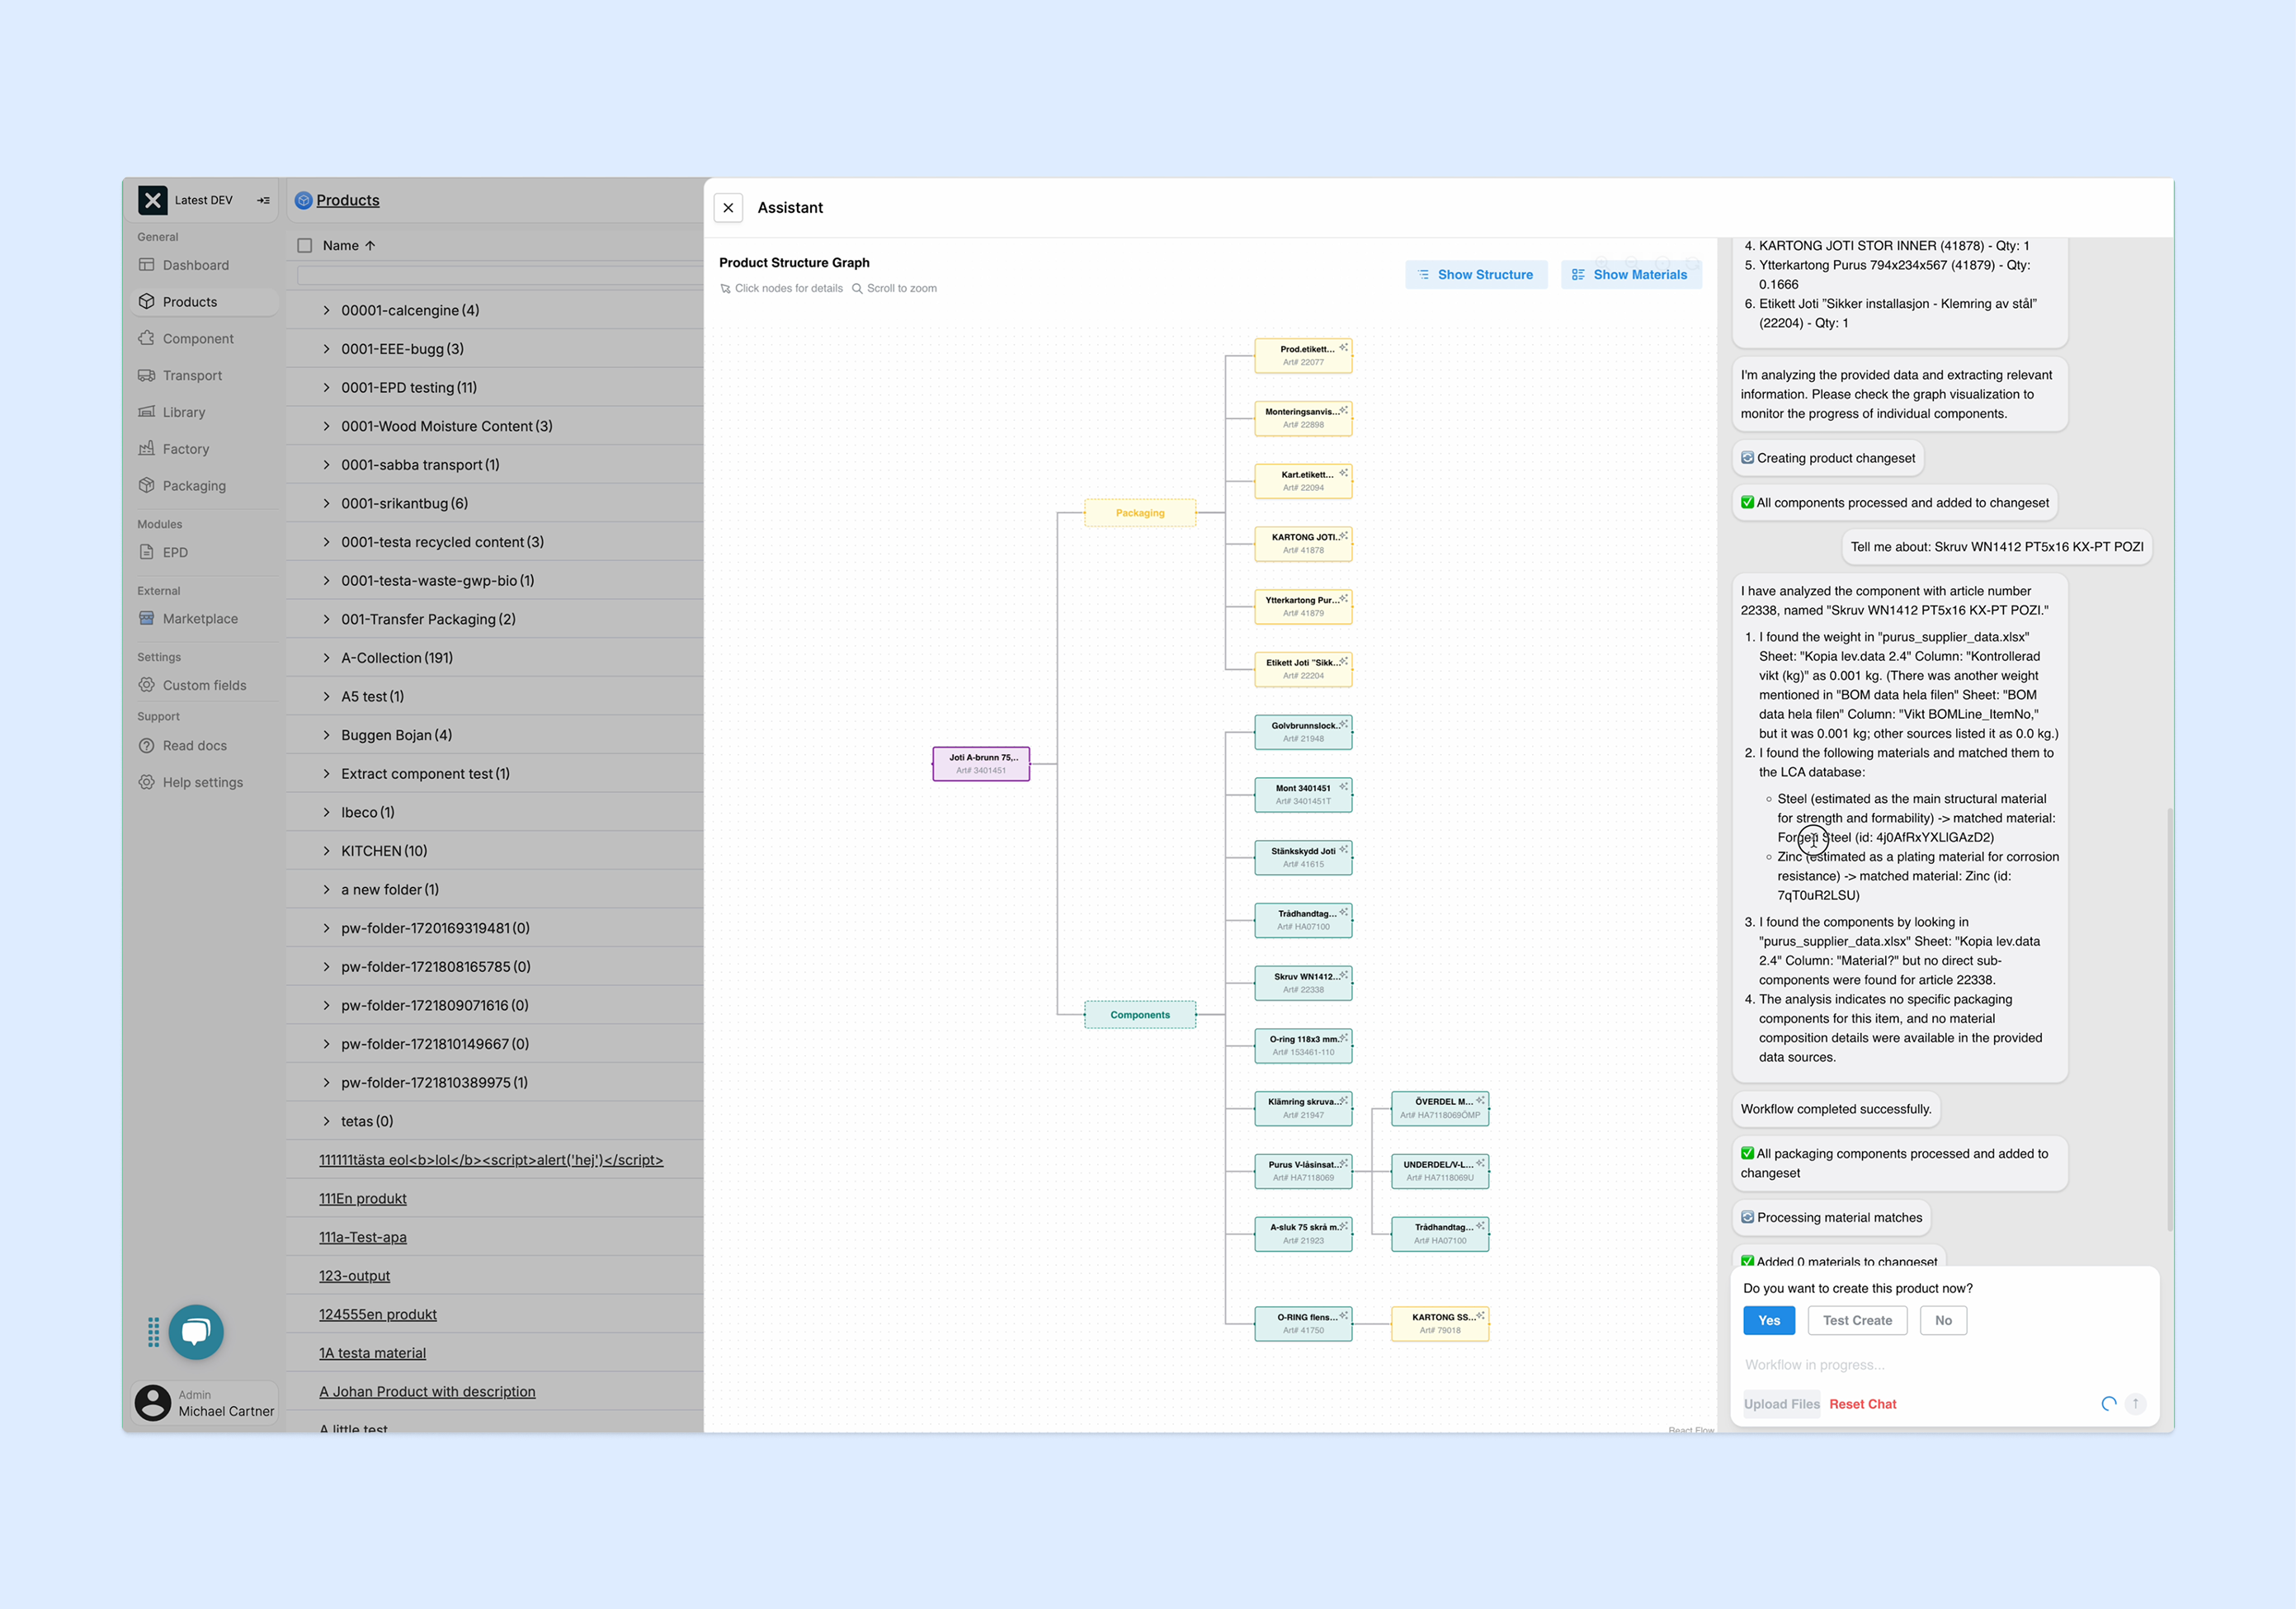
One of the developers created this demo build to test how the AI assistant could process uploaded files and generate a structured product graph. The goal was to validate the technical feasibility of parsing raw data, mapping it against the database, and visualising the output in a clear node-based view.
This prototype was not yet styled or aligned with the design system, but it played an important role in shaping the direction of the final solution. It demonstrated that AI could extract details such as materials, weights, and packaging, then feed them into a visual structure that users could validate and adjust.
By collaborating closely with the development team during this stage, I was able to refine how the UI should present these results, ensuring that the final product balanced technical capabilities with a clear and usable interface.
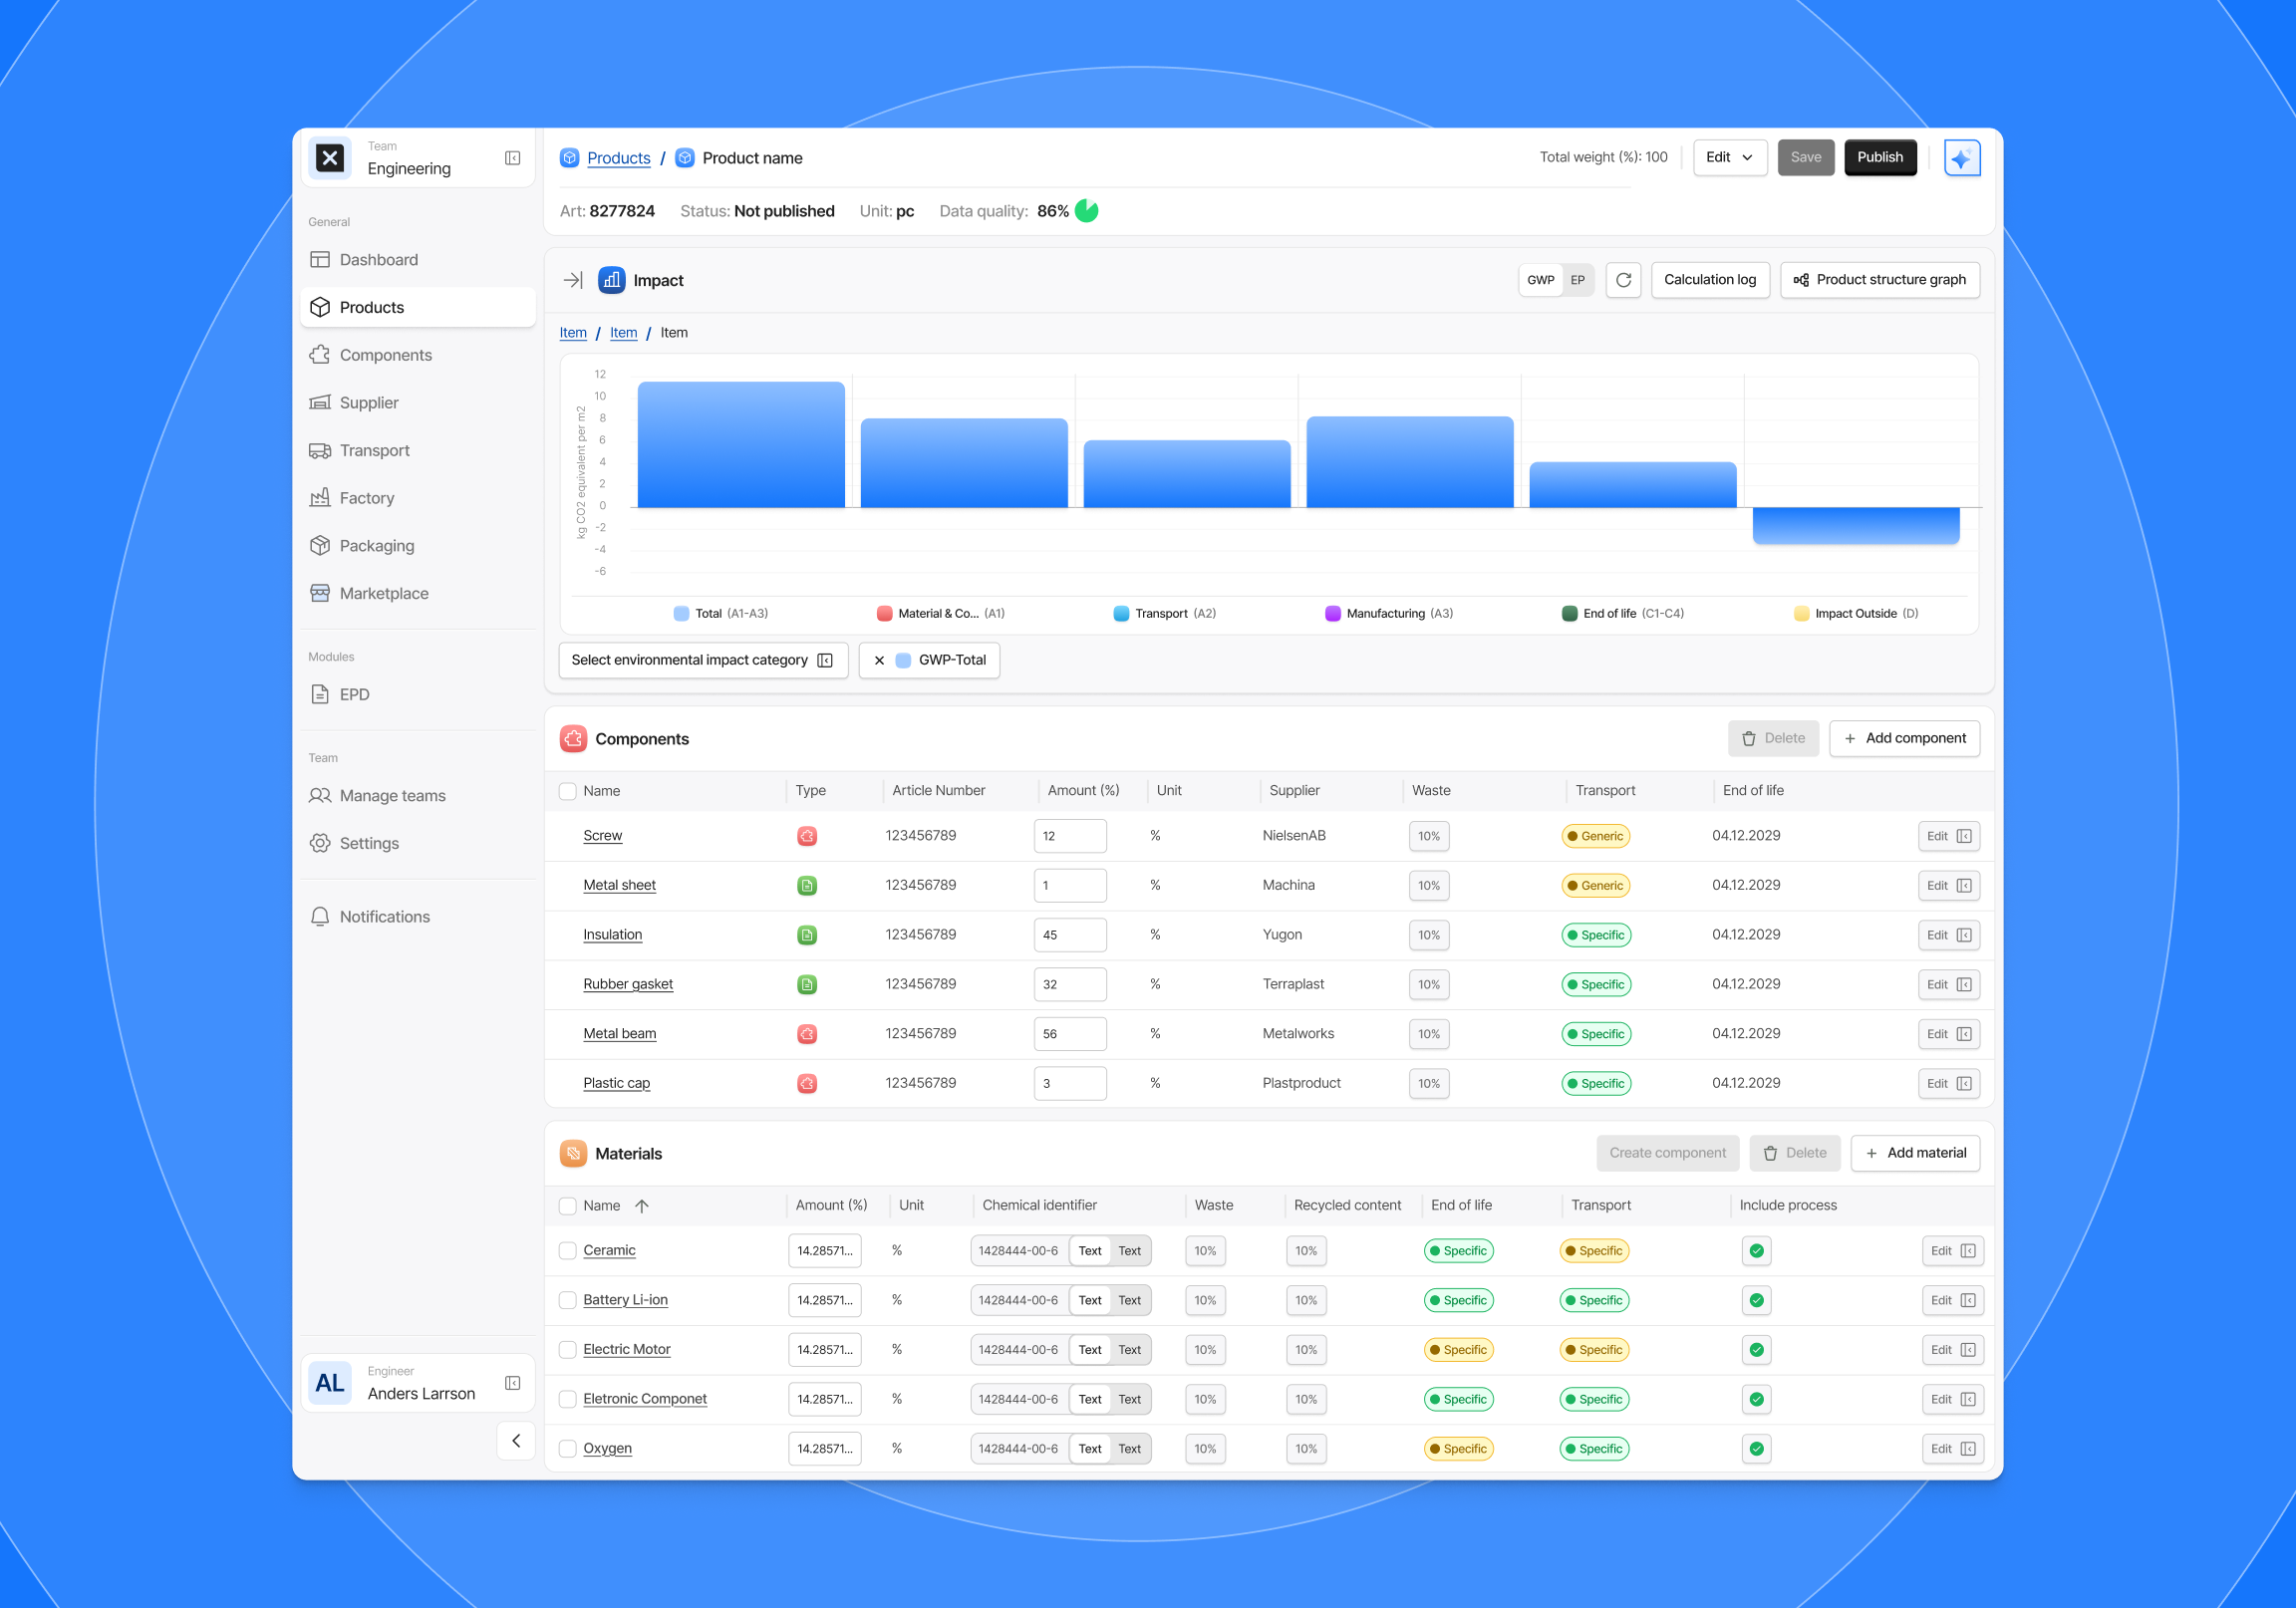
Node-based foundation
We started with a purely manual node-based interface, where users could create and connect components, packaging, and transport data. This established the groundwork for a visual product structure graph.
Benefits of the Canvas and Node-Based Design
Through the integration of AI, we learned how to transform one of the most time-consuming and complex parts of sustainability reporting: the creation of Environmental Product Declarations (EPDs). Traditionally, producing an EPD could take up to six months, requiring extensive manual data collection, cross-referencing, and validation. With the new AI-powered workflow inside EandoX, the same process can now be completed in a matter of minutes.
The canvas functionality played a central role in this breakthrough. It offered users a flexible space where they could build and explore complex product structures without losing clarity. A node-based Sankey diagram turned hidden data relationships into something visual and easy to understand. This allowed users to see how products, components, materials, transport, and packaging connected, as well as the environmental impact of each part.
This visual approach provided several benefits:
- Transparency: complex supply chains became easier to understand at a glance.
- Scalability: the canvas could grow as new components, materials, or transport routes were added.
- Speed: AI handled the heavy lifting of parsing files, generating product structures, and suggesting attributes, while the canvas and Sankey diagram gave users an immediate way to validate and act on the results.
By combining AI with an interactive node-based design, we shifted sustainability compliance from a slow, manual task to a dynamic and collaborative experience. The new approach cut time and costs while also giving companies the tools to make more informed decisions about their environmental impact.
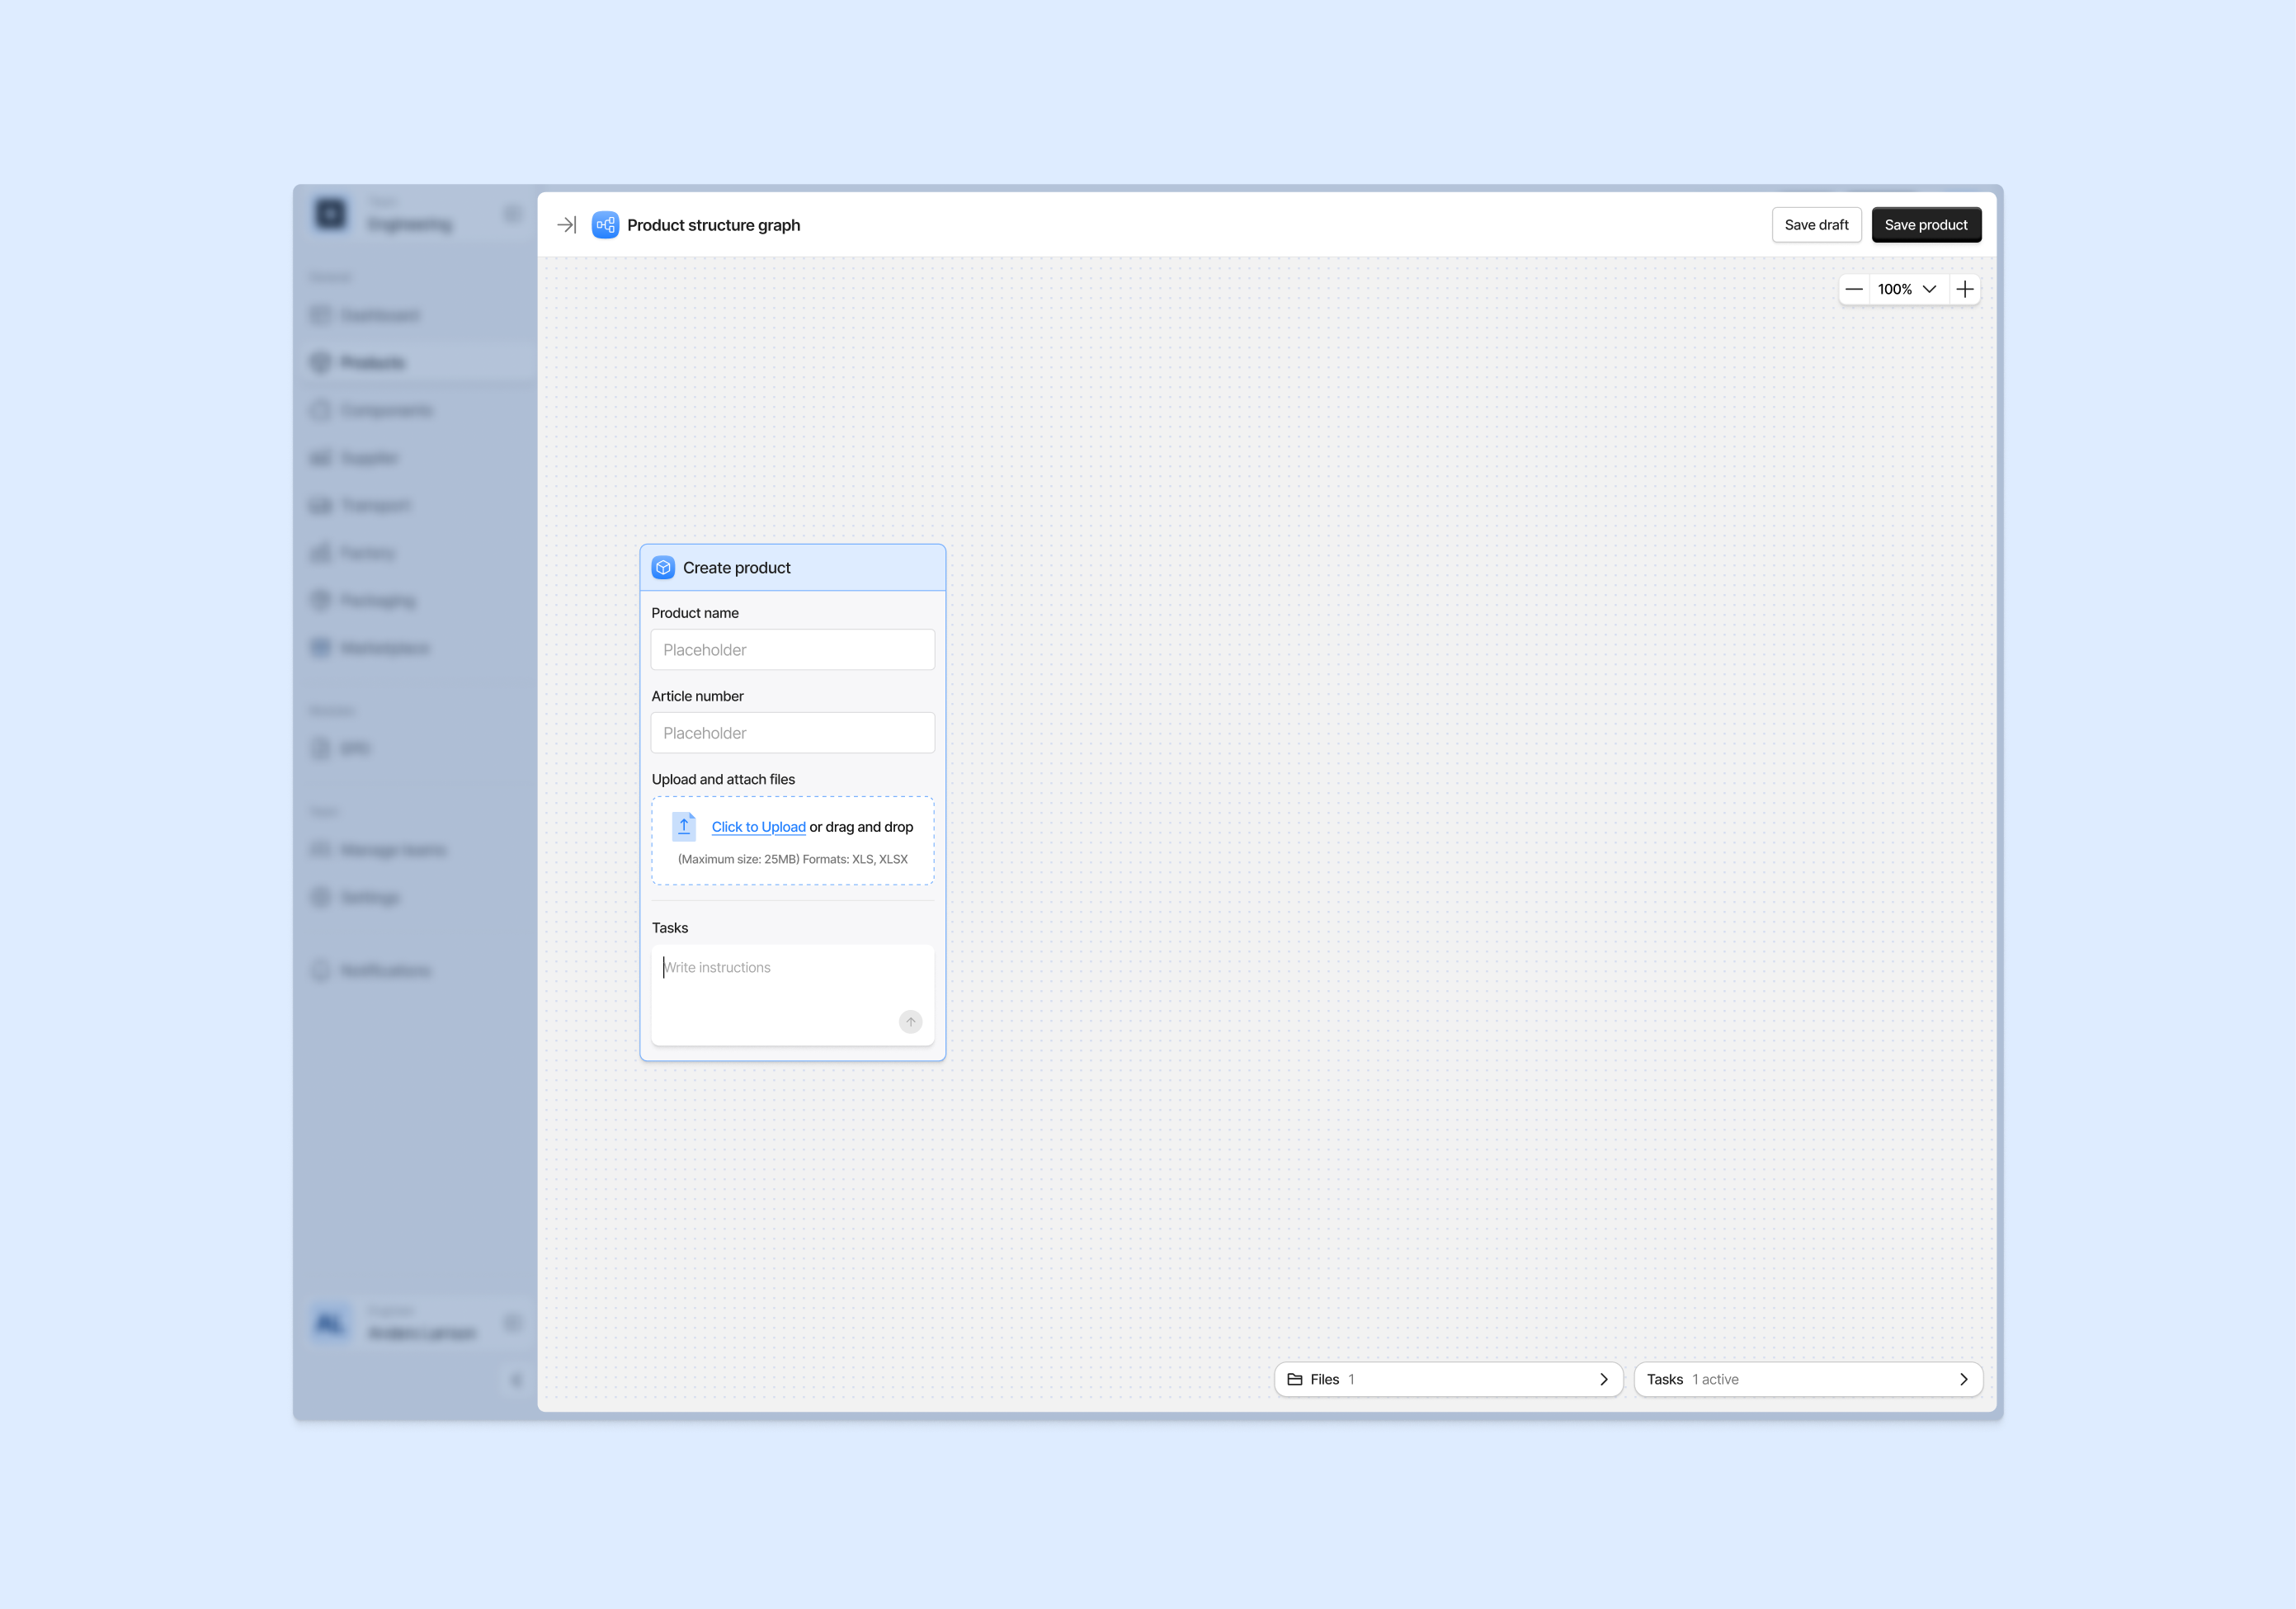
Product node on an empty canvas
We introduced the concept of a central product node, added to an empty canvas. This became the anchor point for AI-generated structures.
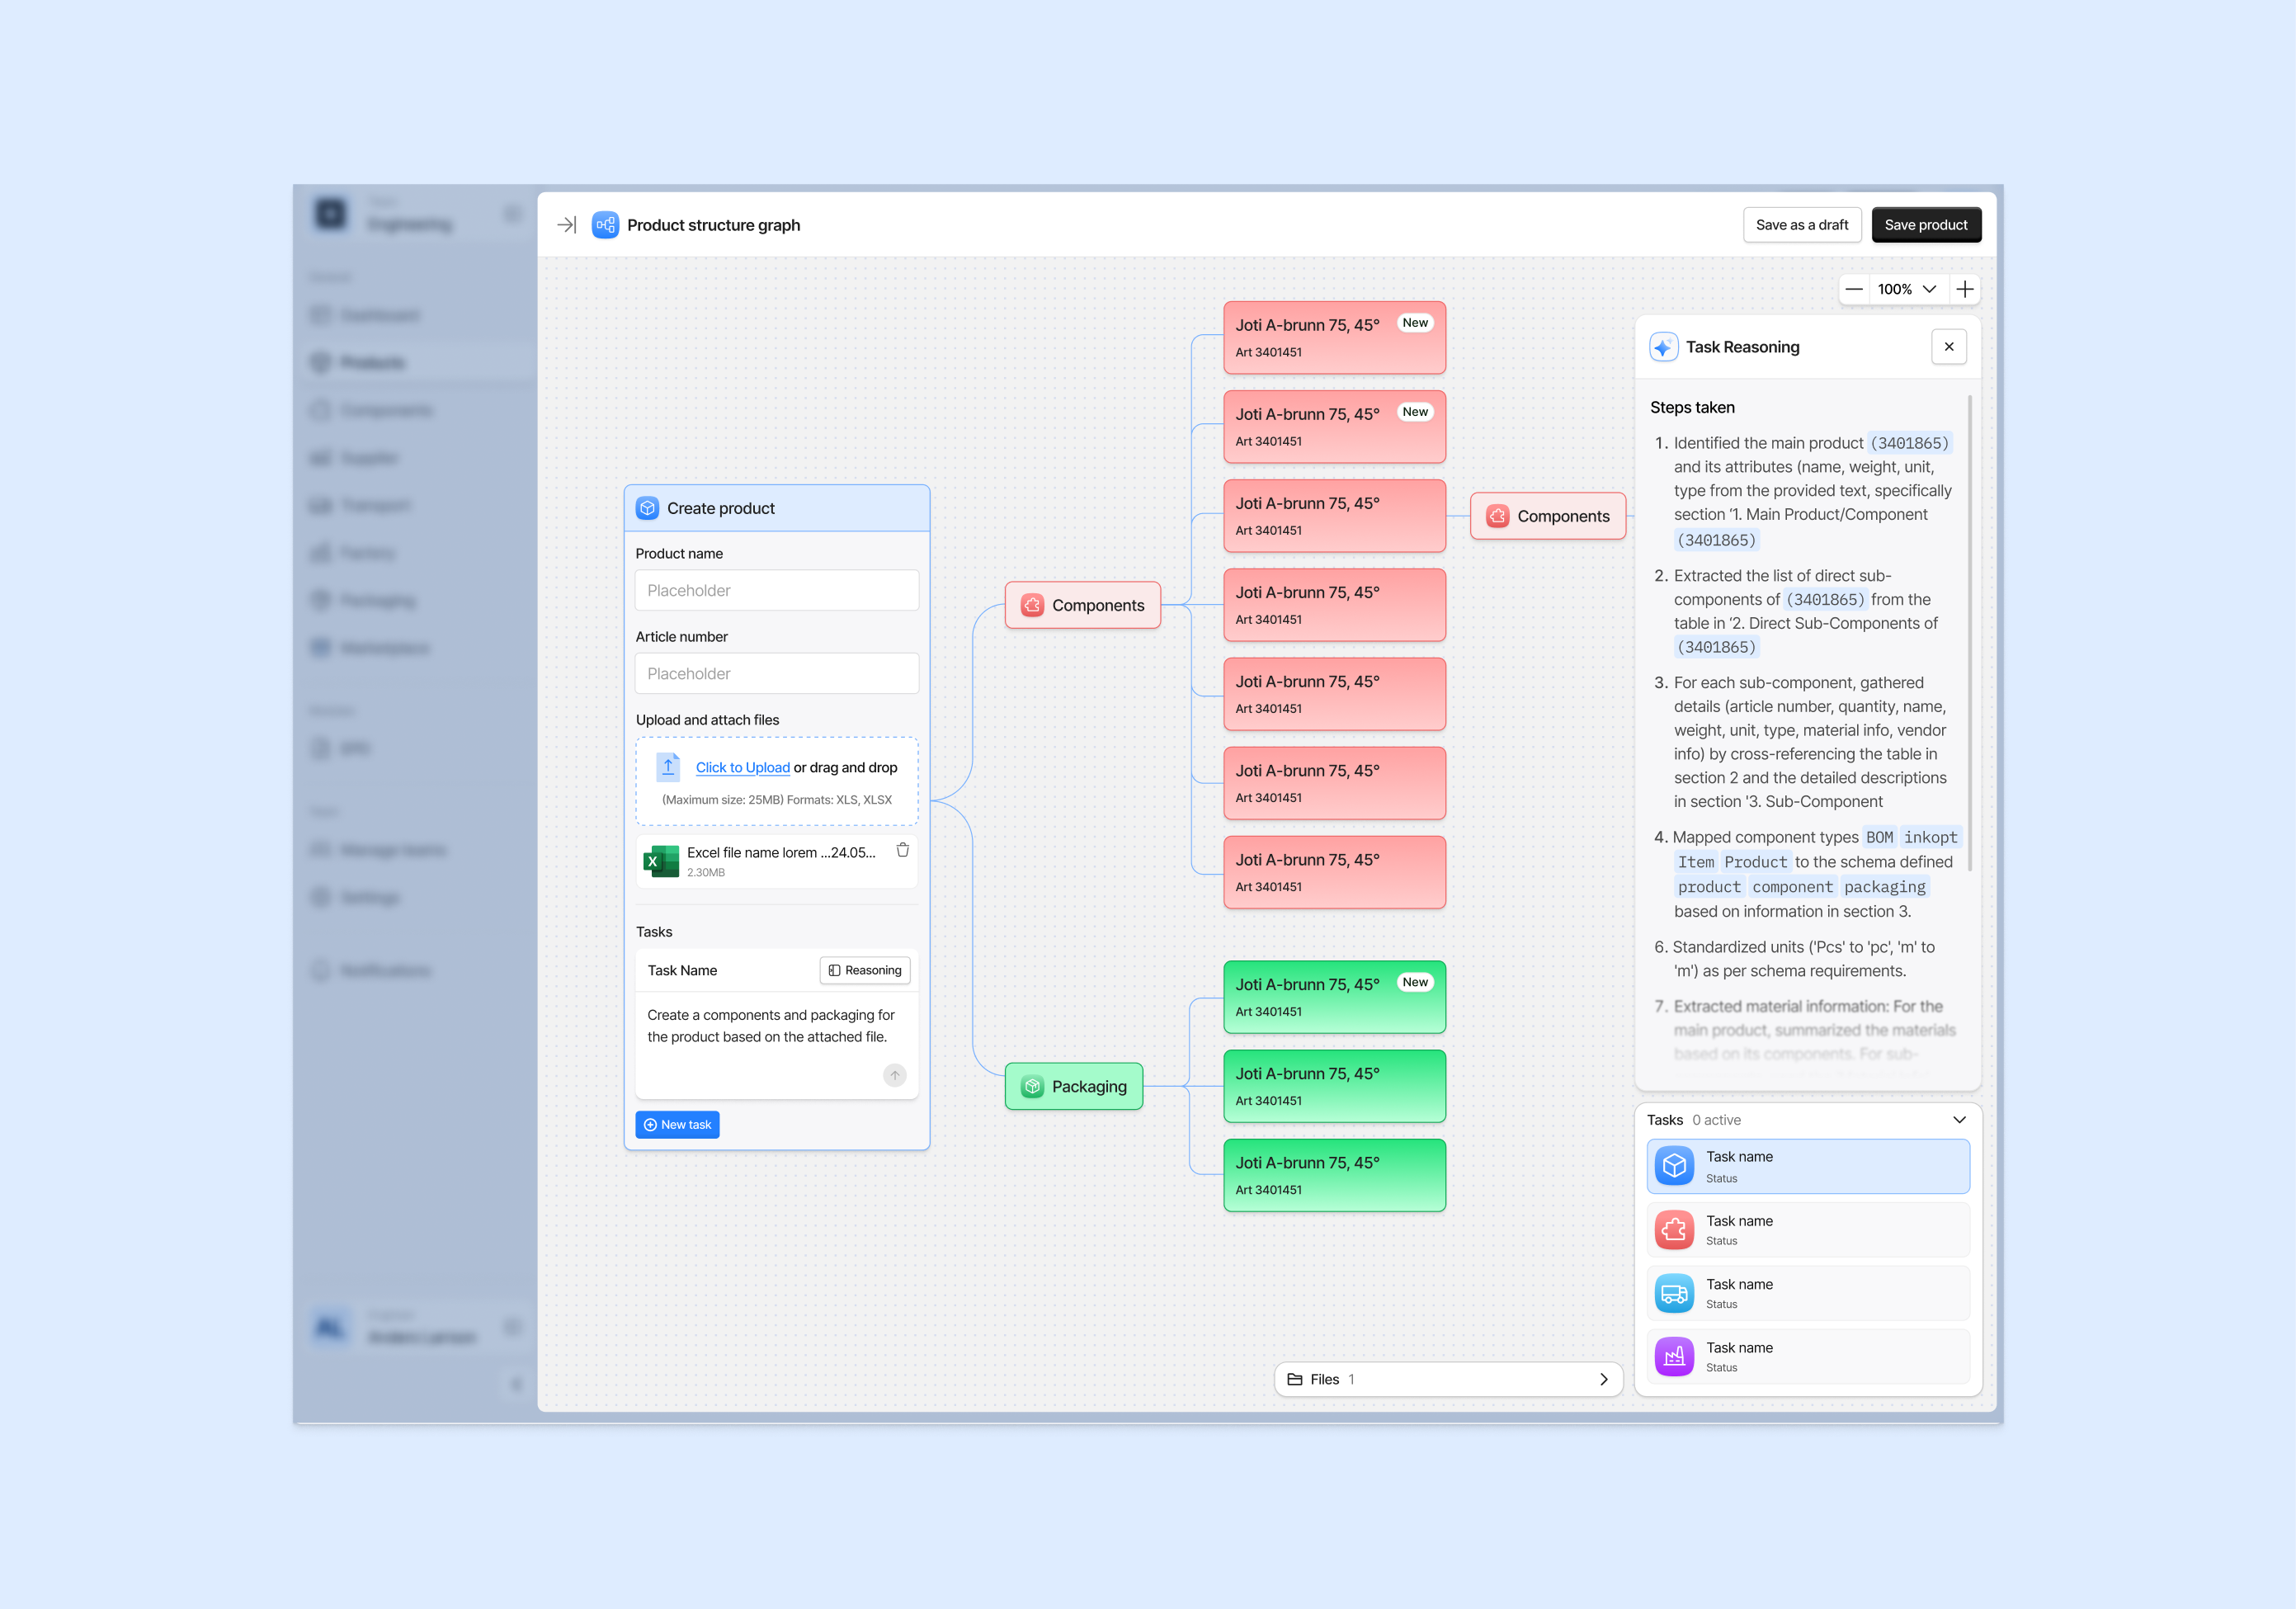
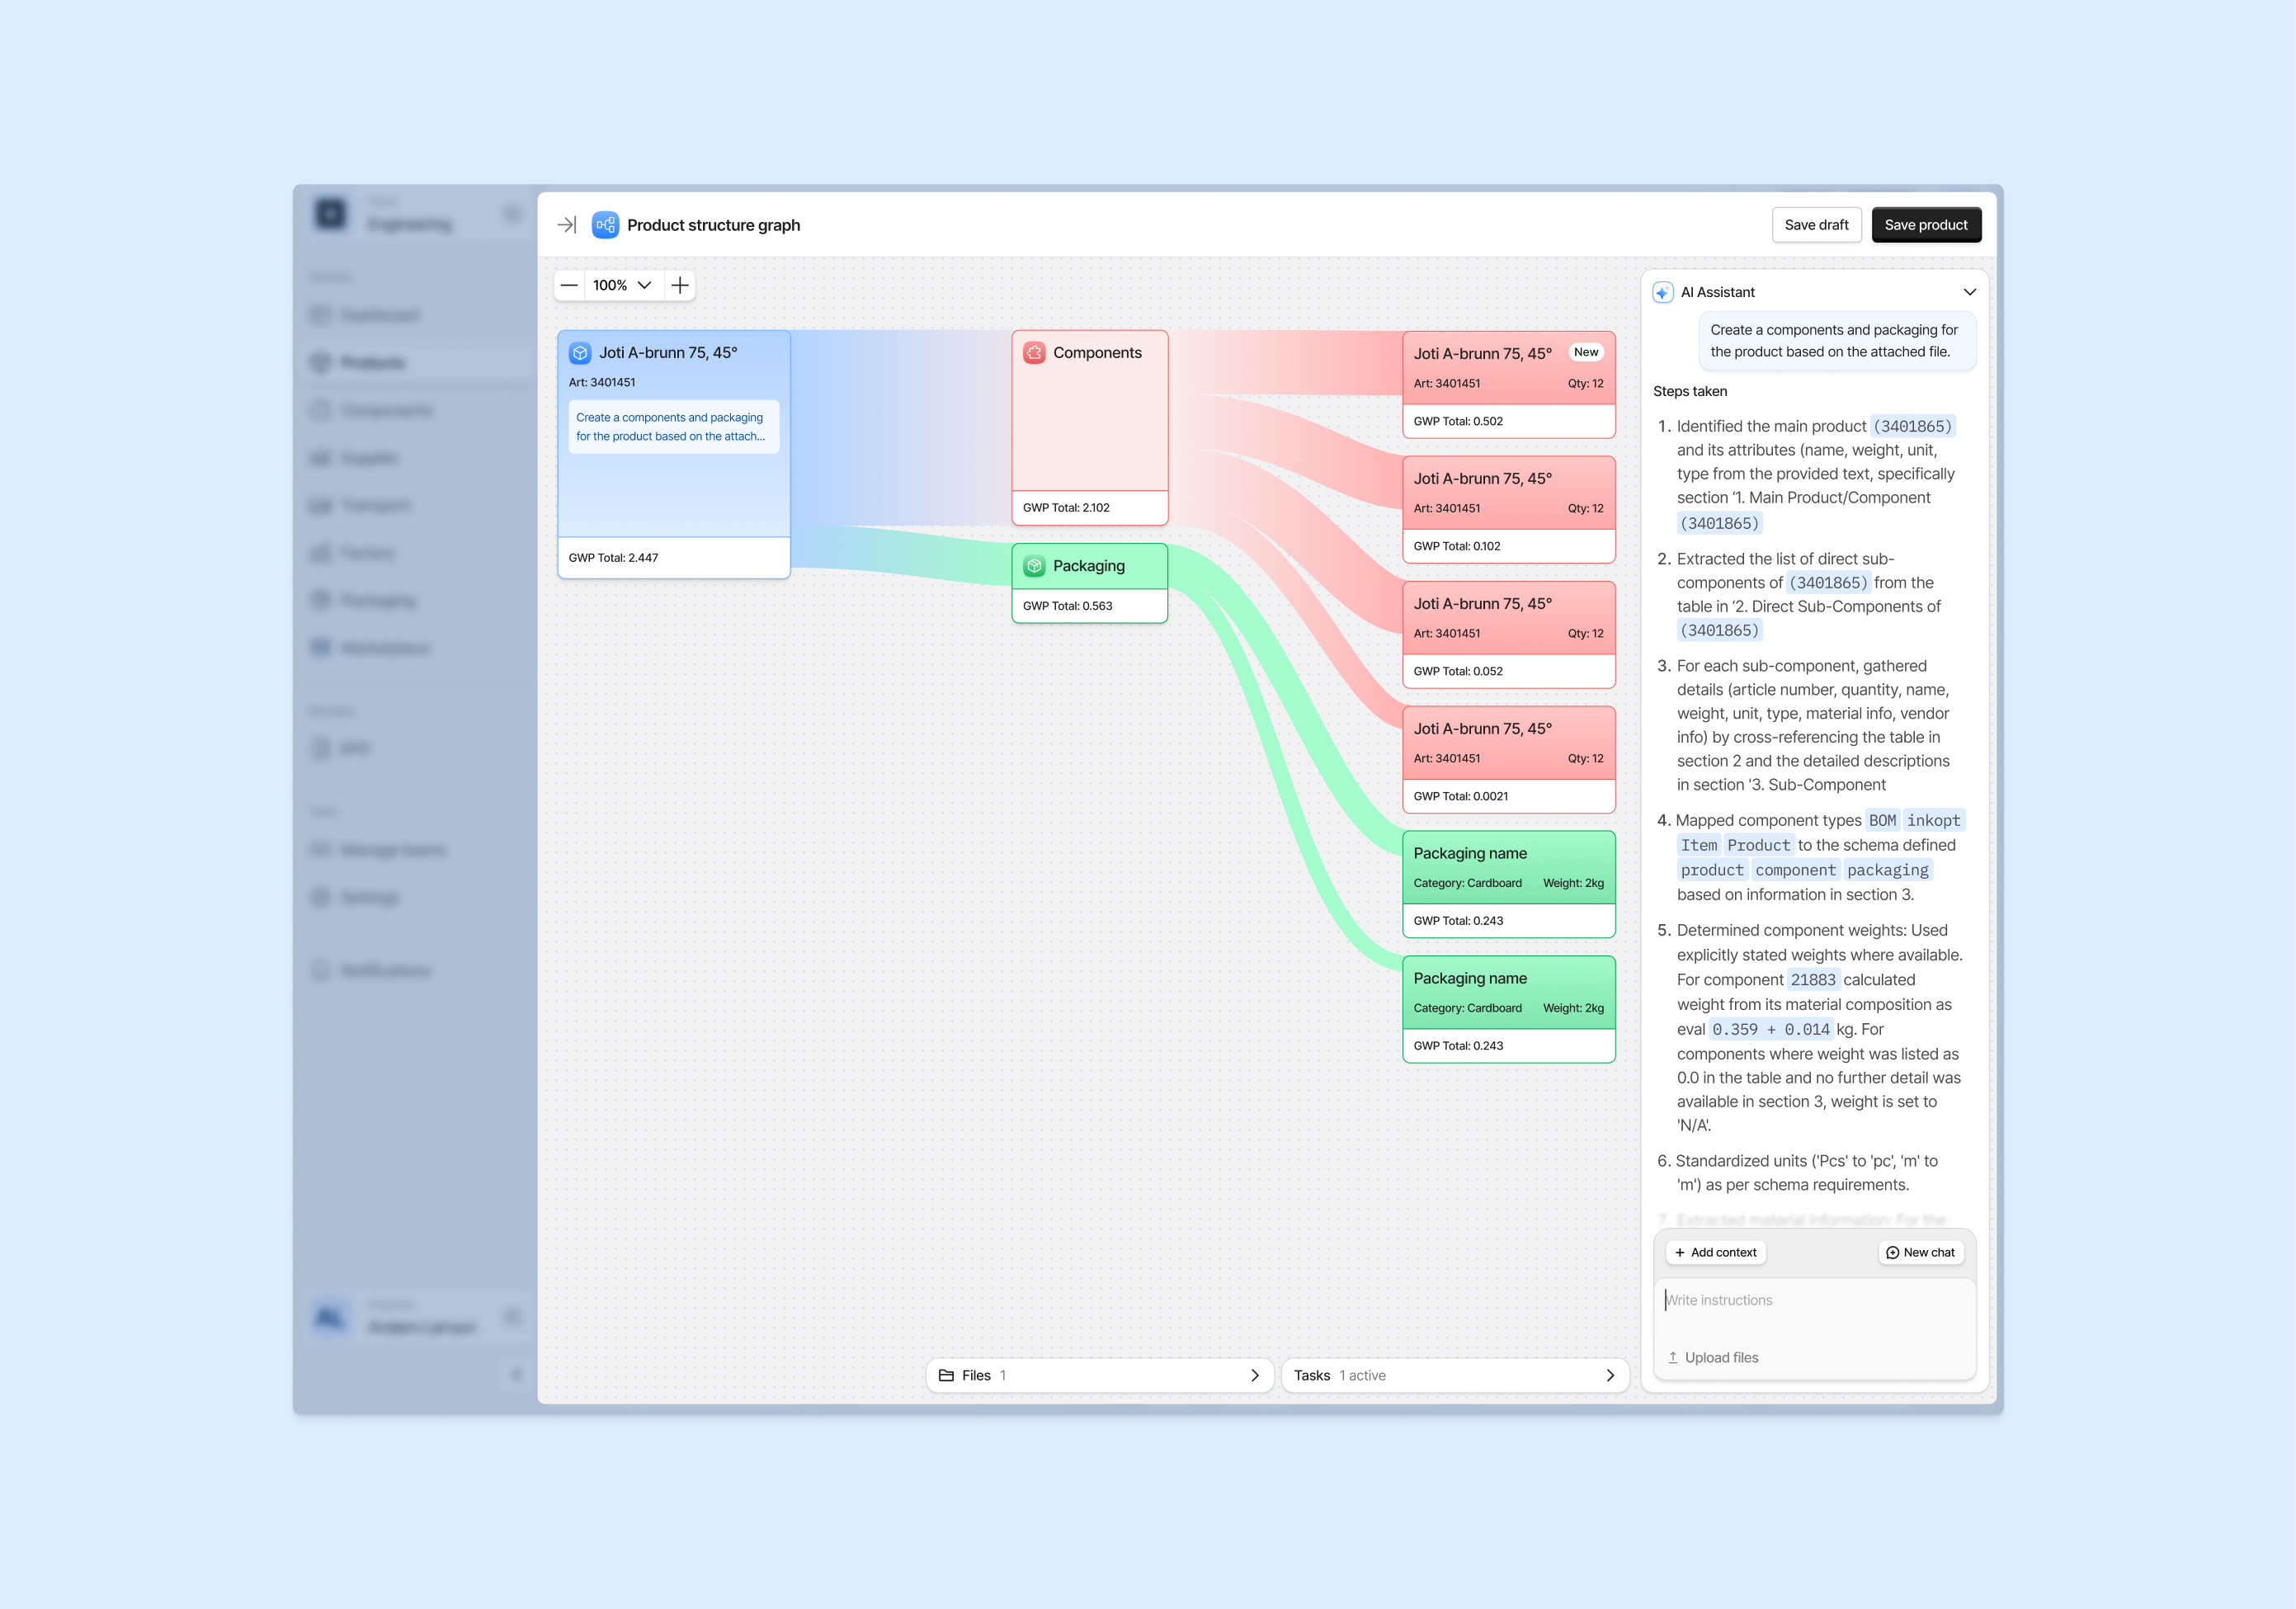
AI generating product structure
With AI integrated, users could upload a file or provide context, and the system would automatically generate nodes for components and packaging. The AI’s reasoning was shown step by step, ensuring transparency and trust.
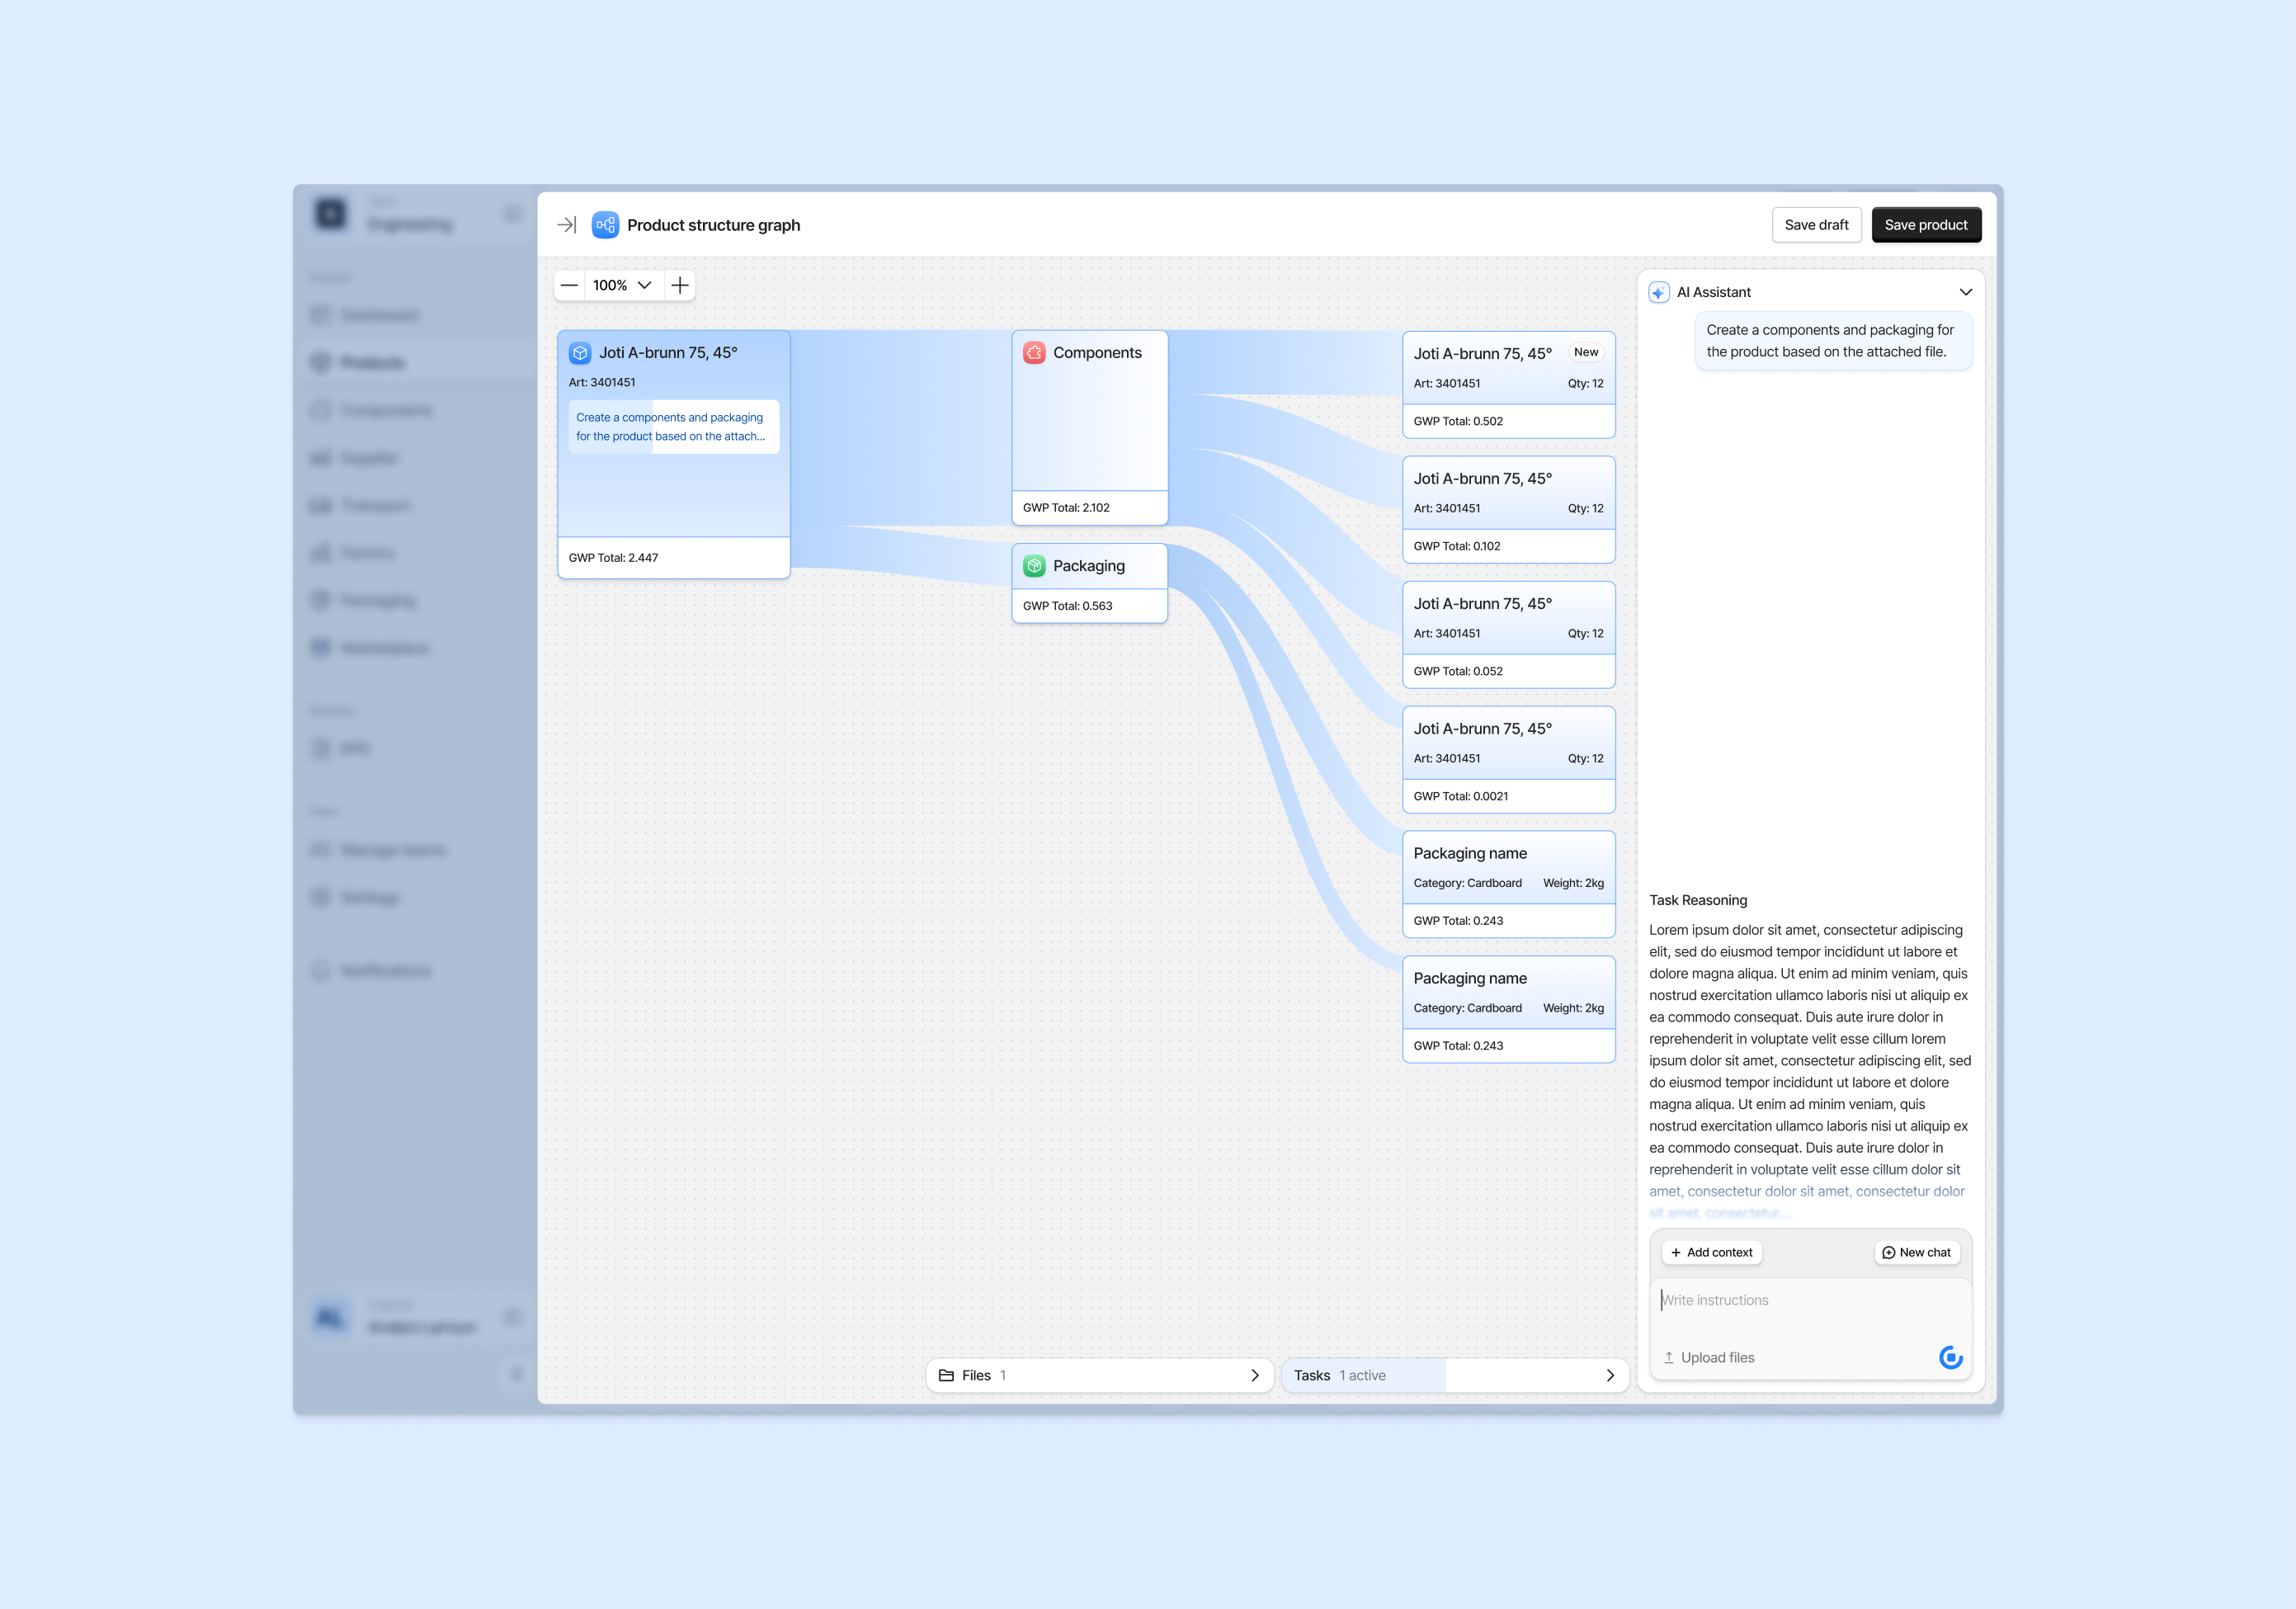
Generated product view
Once generated, the product node expanded into a visual structure of components and packaging, with environmental impact values directly visible. Users could accept or refine the AI’s suggestions in real time.
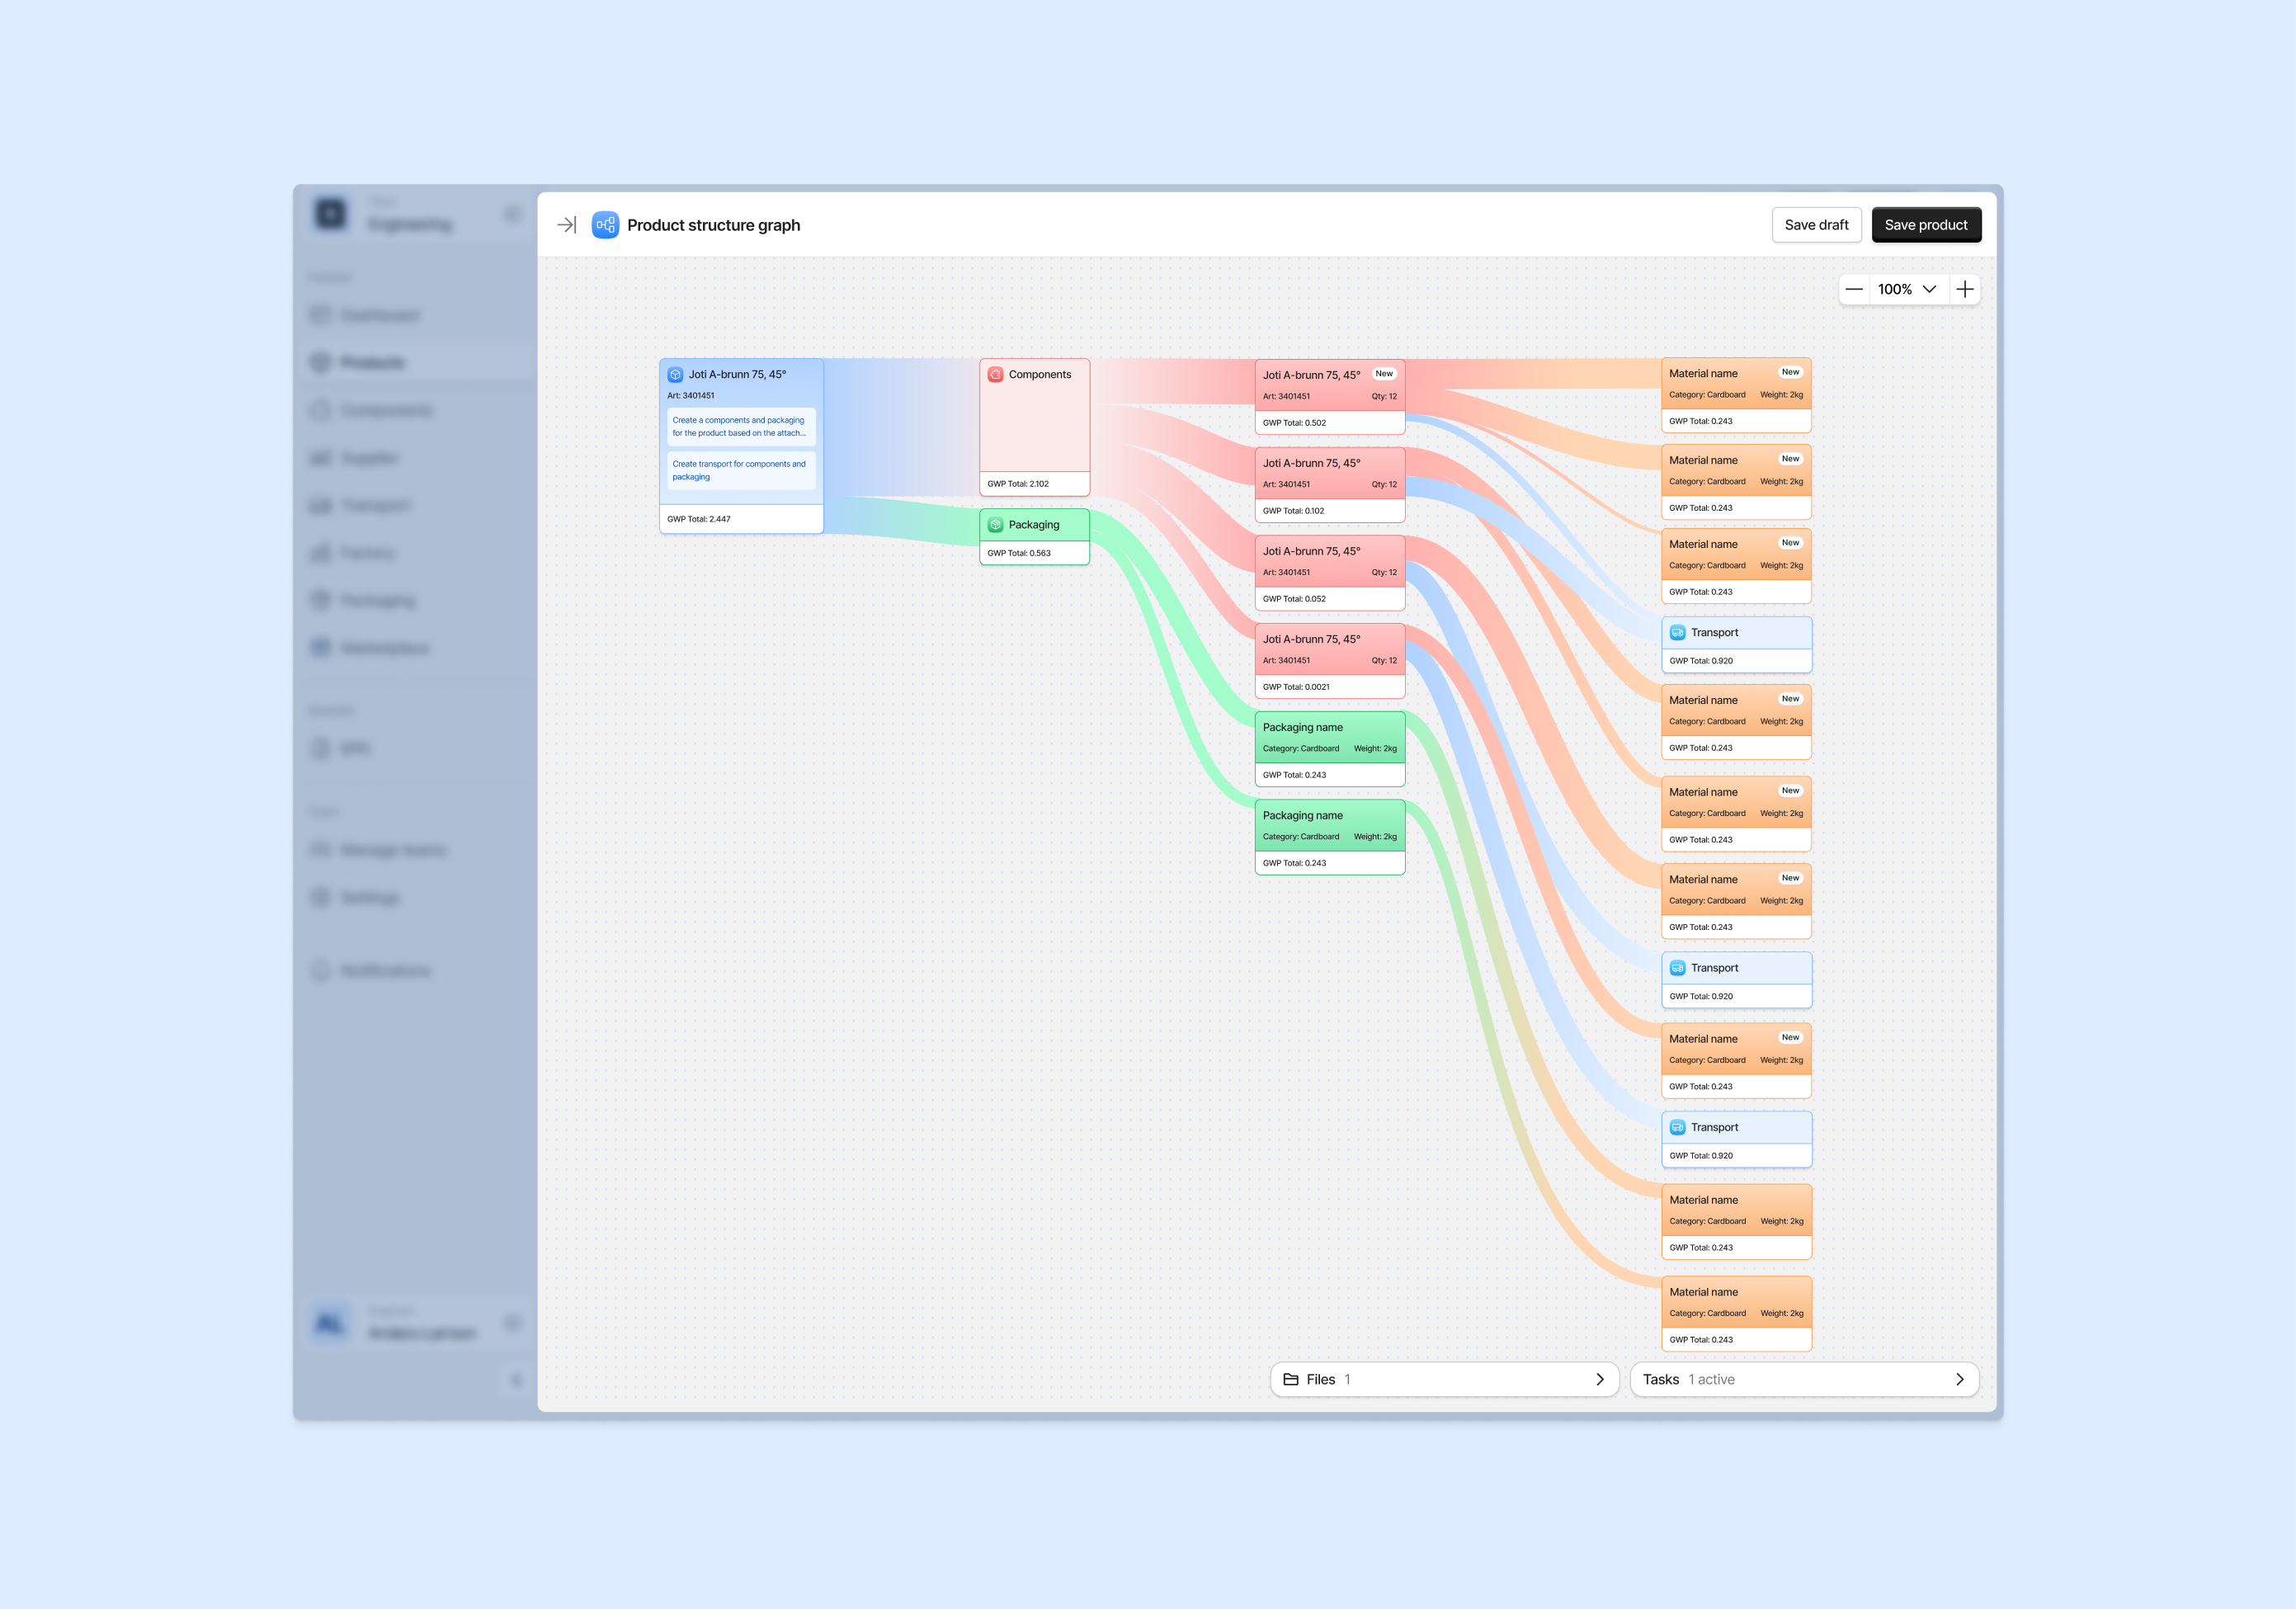
Expanded with materials and transport
In the final stage, AI added deeper detail by including materials and transport nodes. This created a complete Sankey diagram that revealed the entire product lifecycle, enabling companies to move from file upload to a structured Environmental Product Declaration in minutes — a process that traditionally took up to six months.
5. Other deliverables
AI prototype
This is a V0 prototype I created to explore how I can ship components directly.
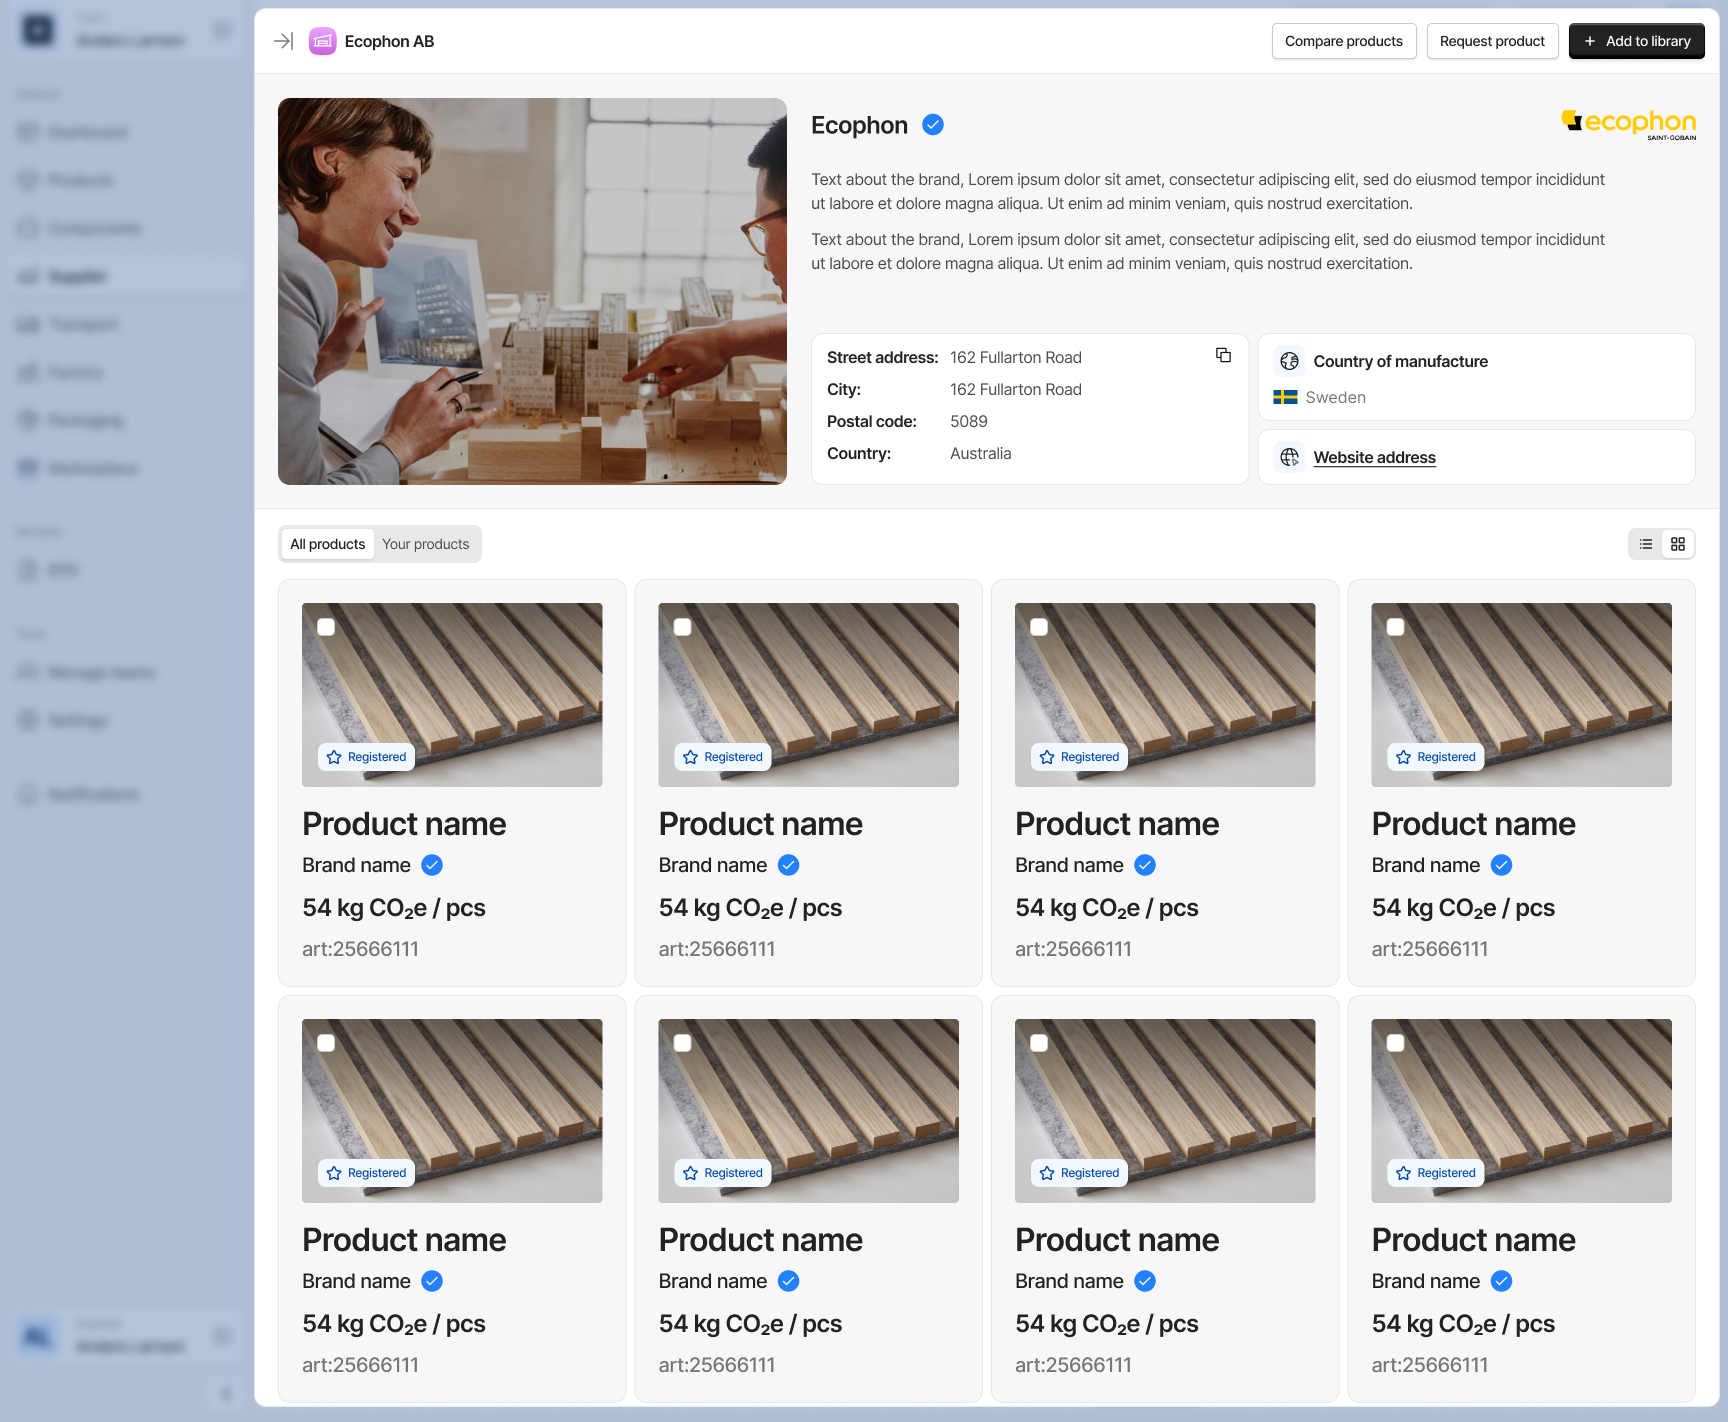
Supplier page
A dedicated space for managing supplier data and contributions
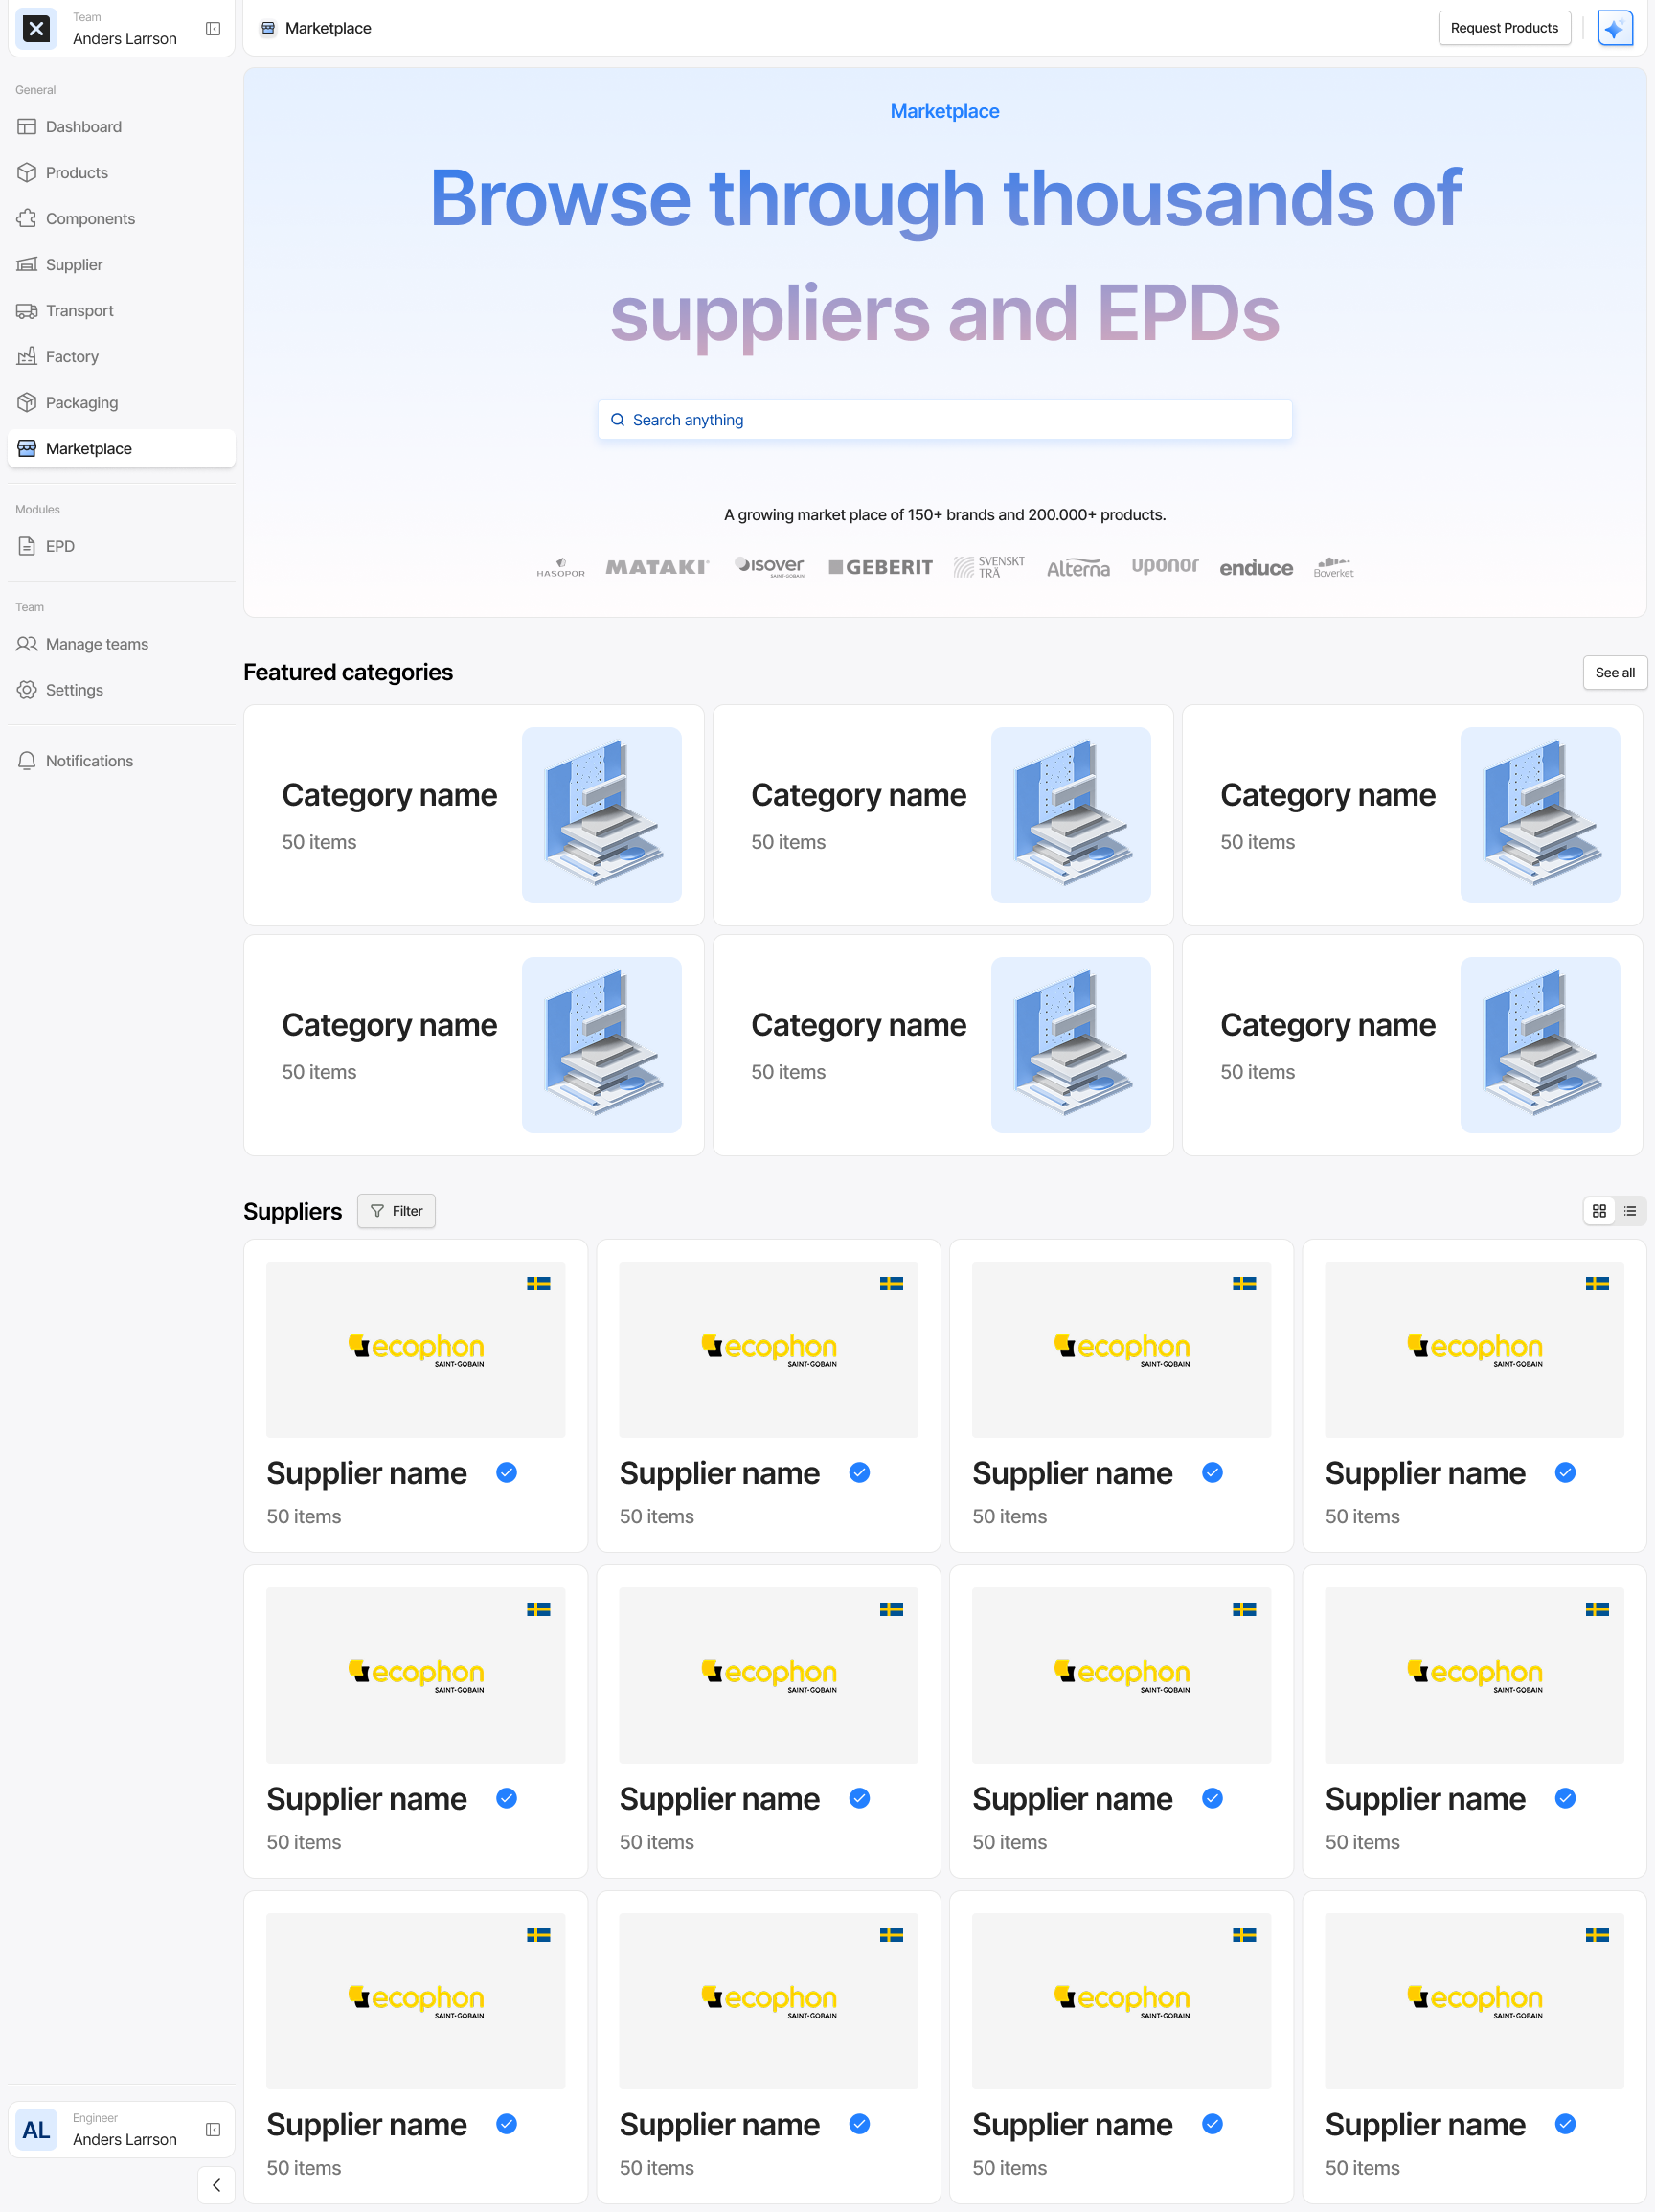
Marketplace
An overview of components and sourcing options
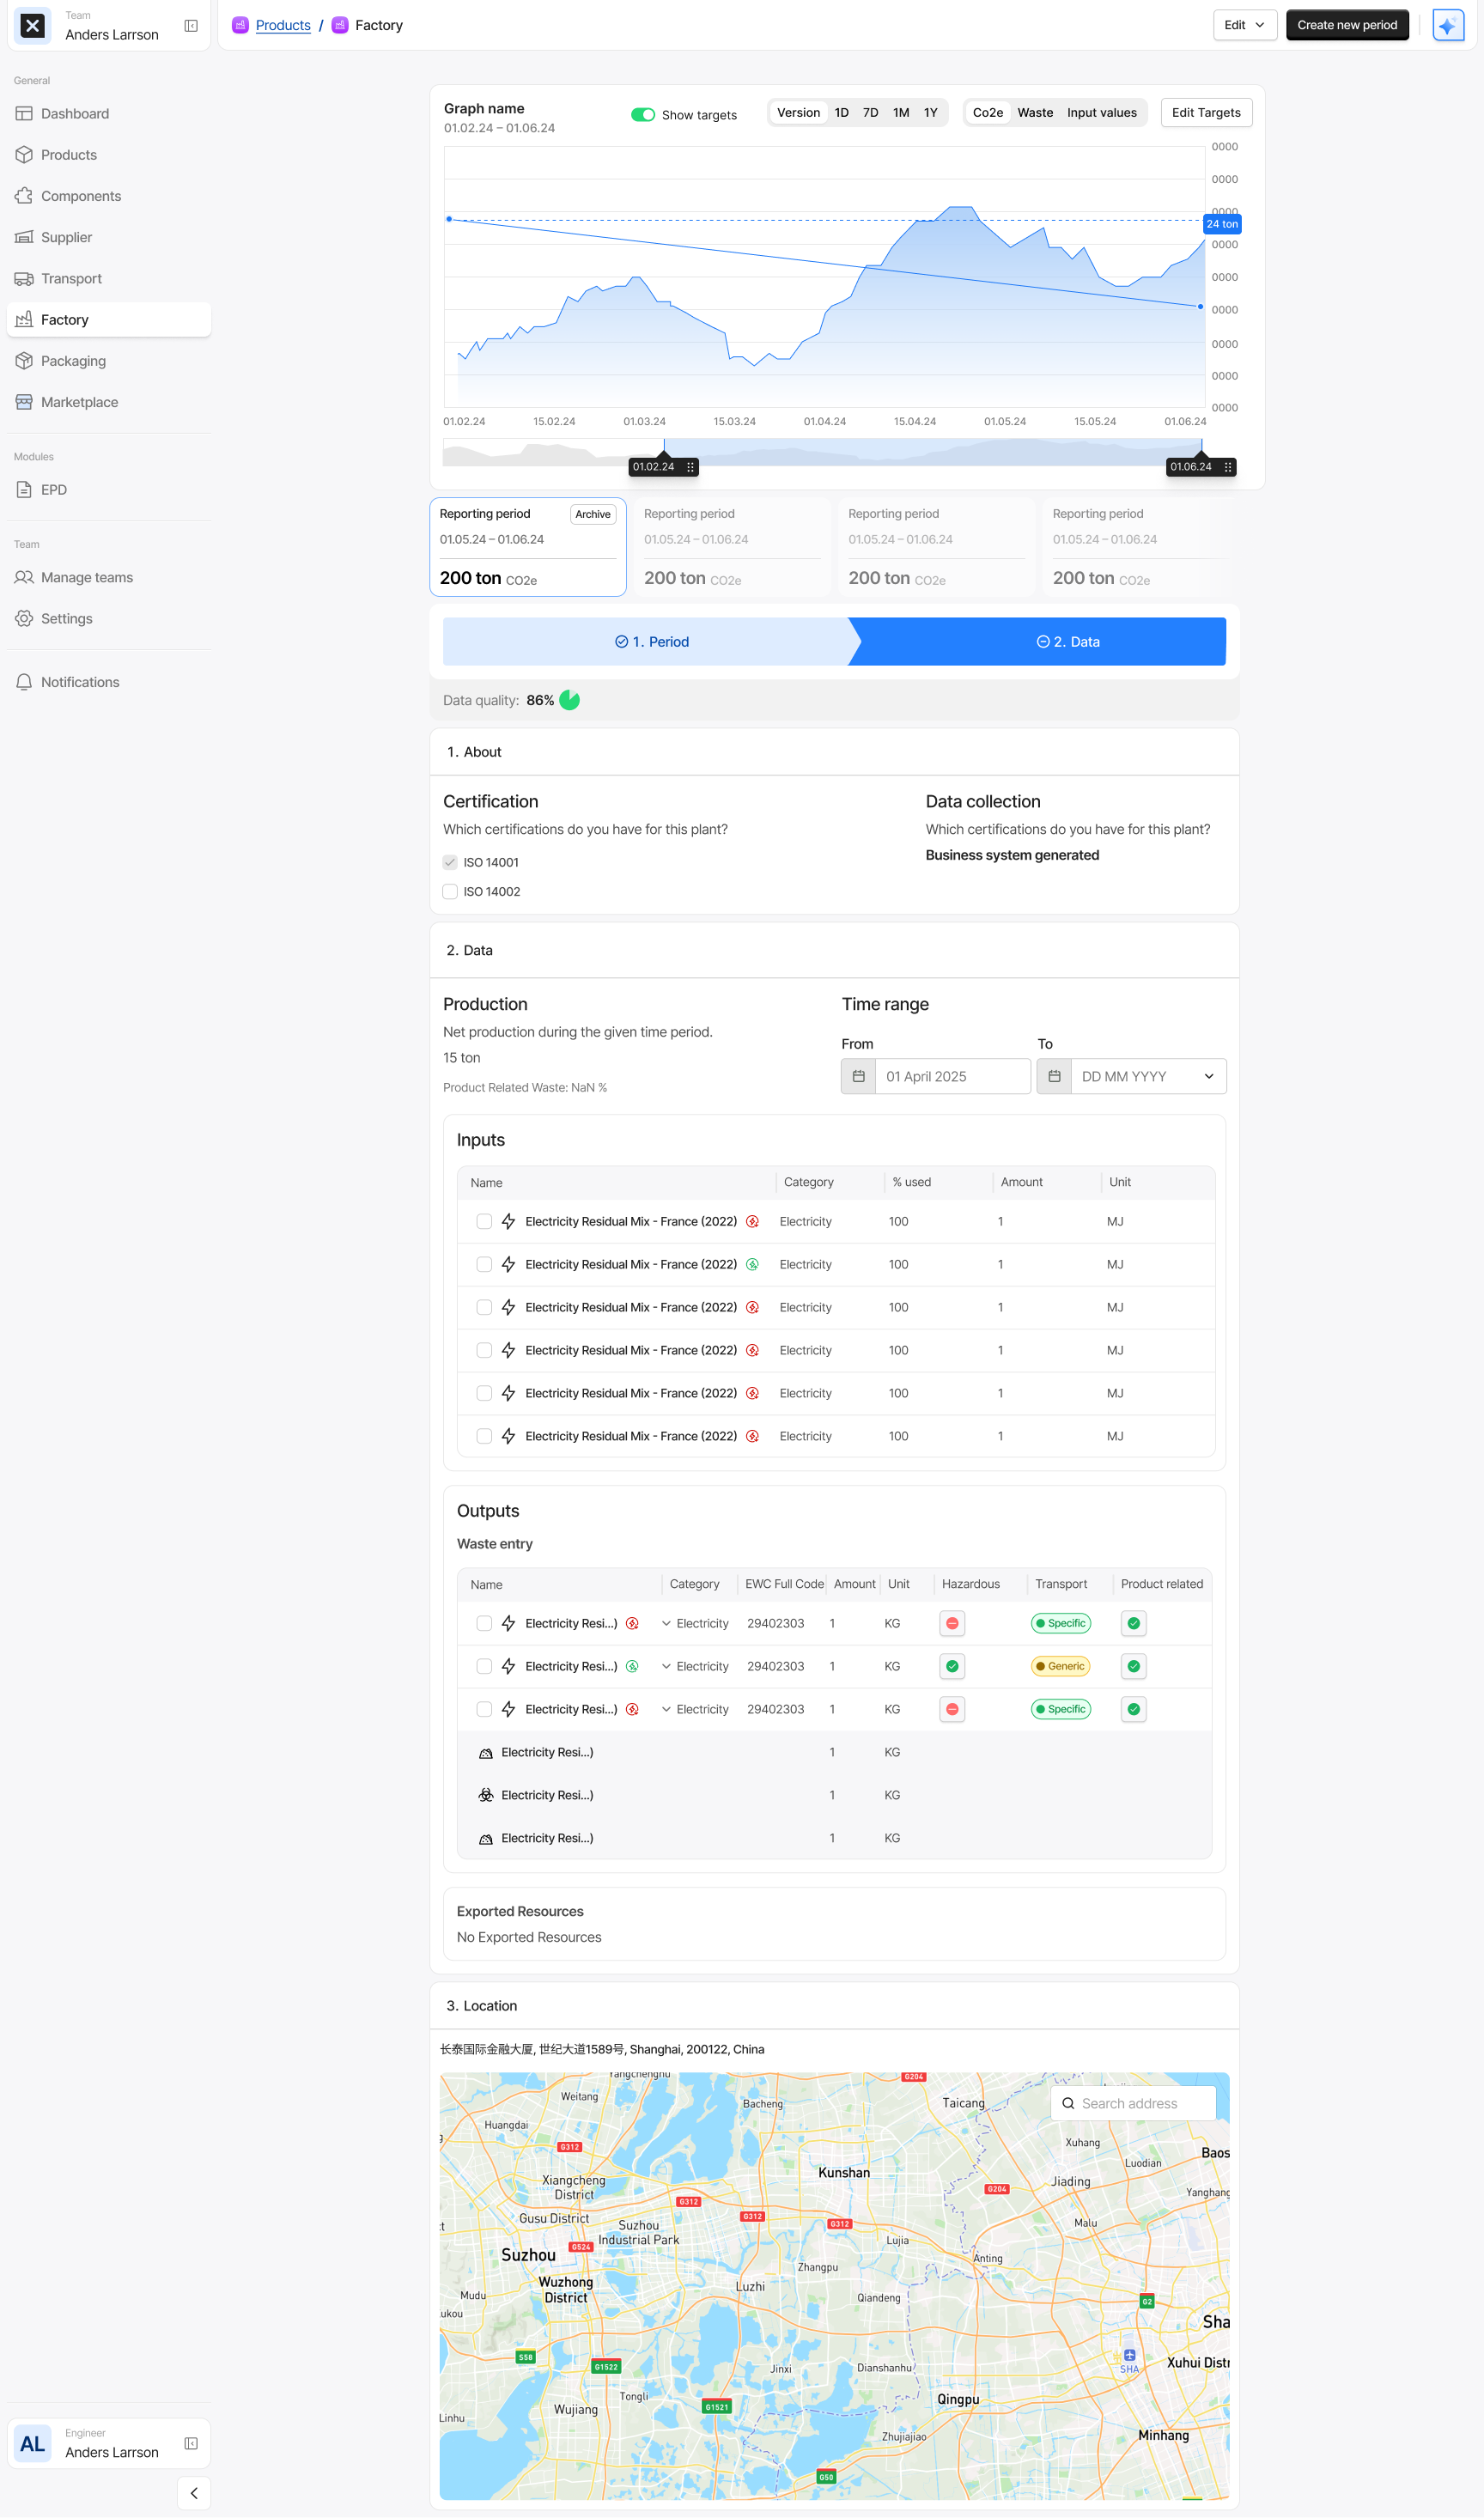
FActory data
Structured inputs for production and process information
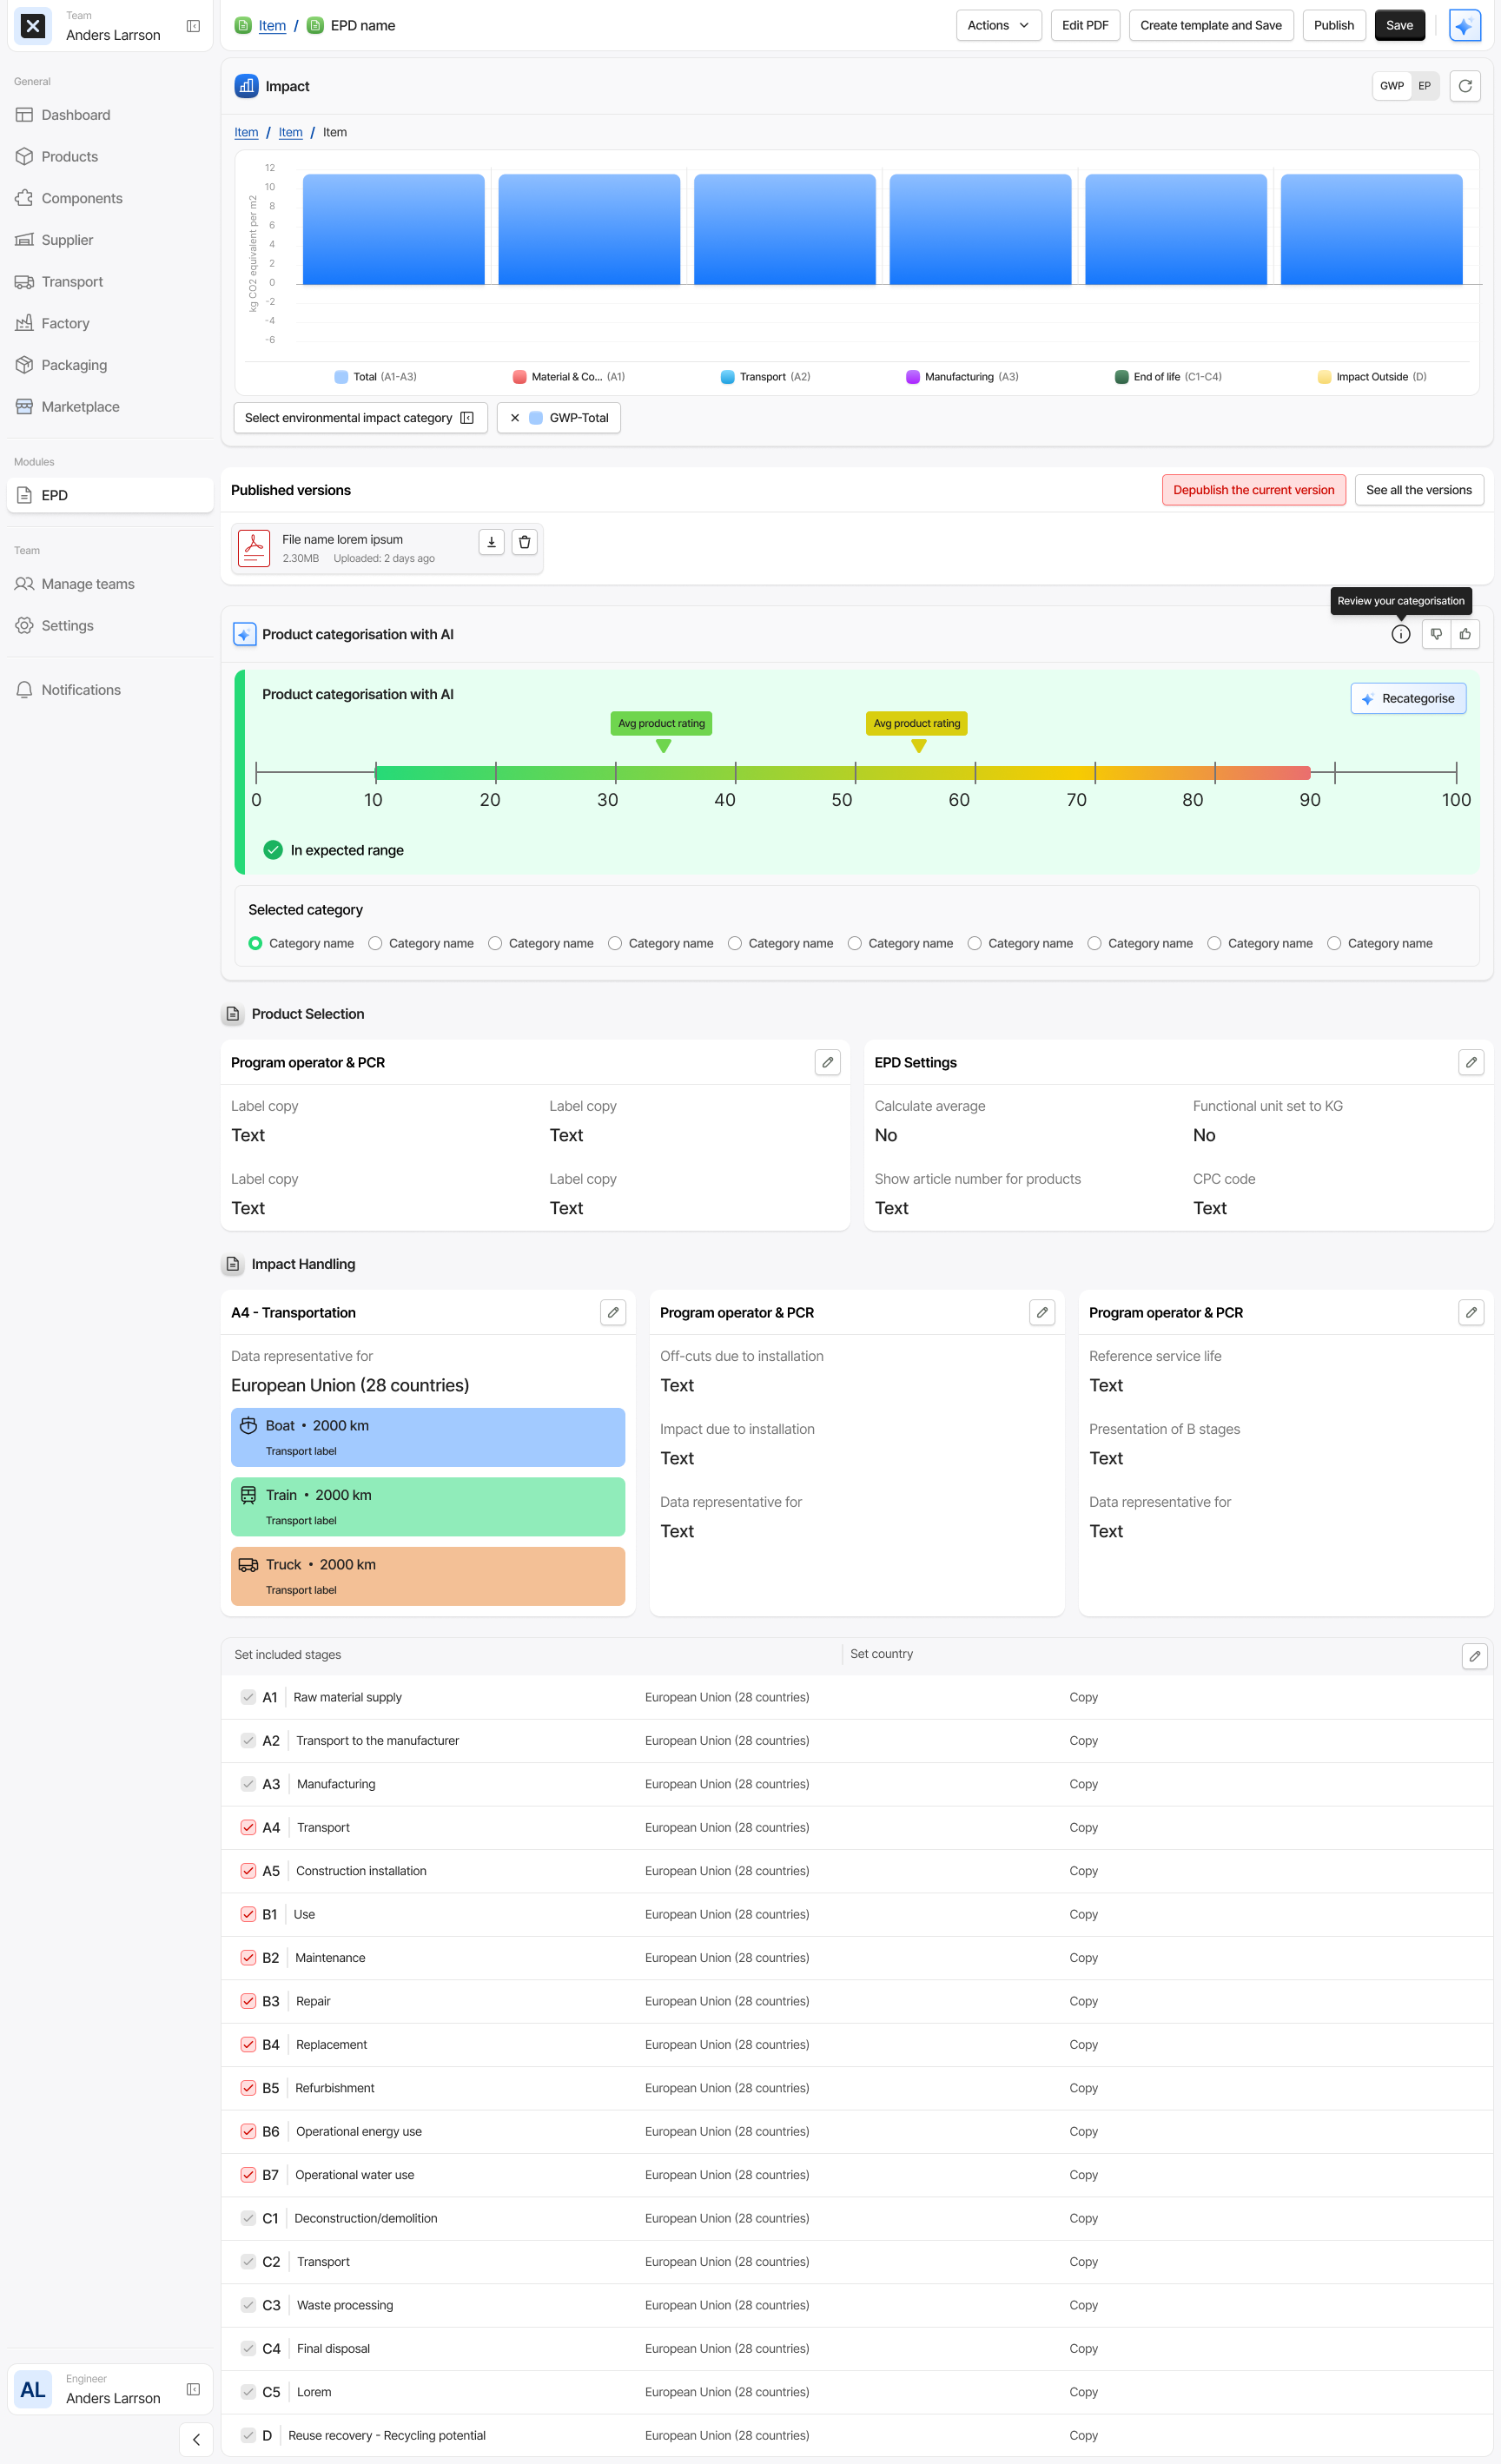
EPD
A central place to generate and review Environmental Product Declarations
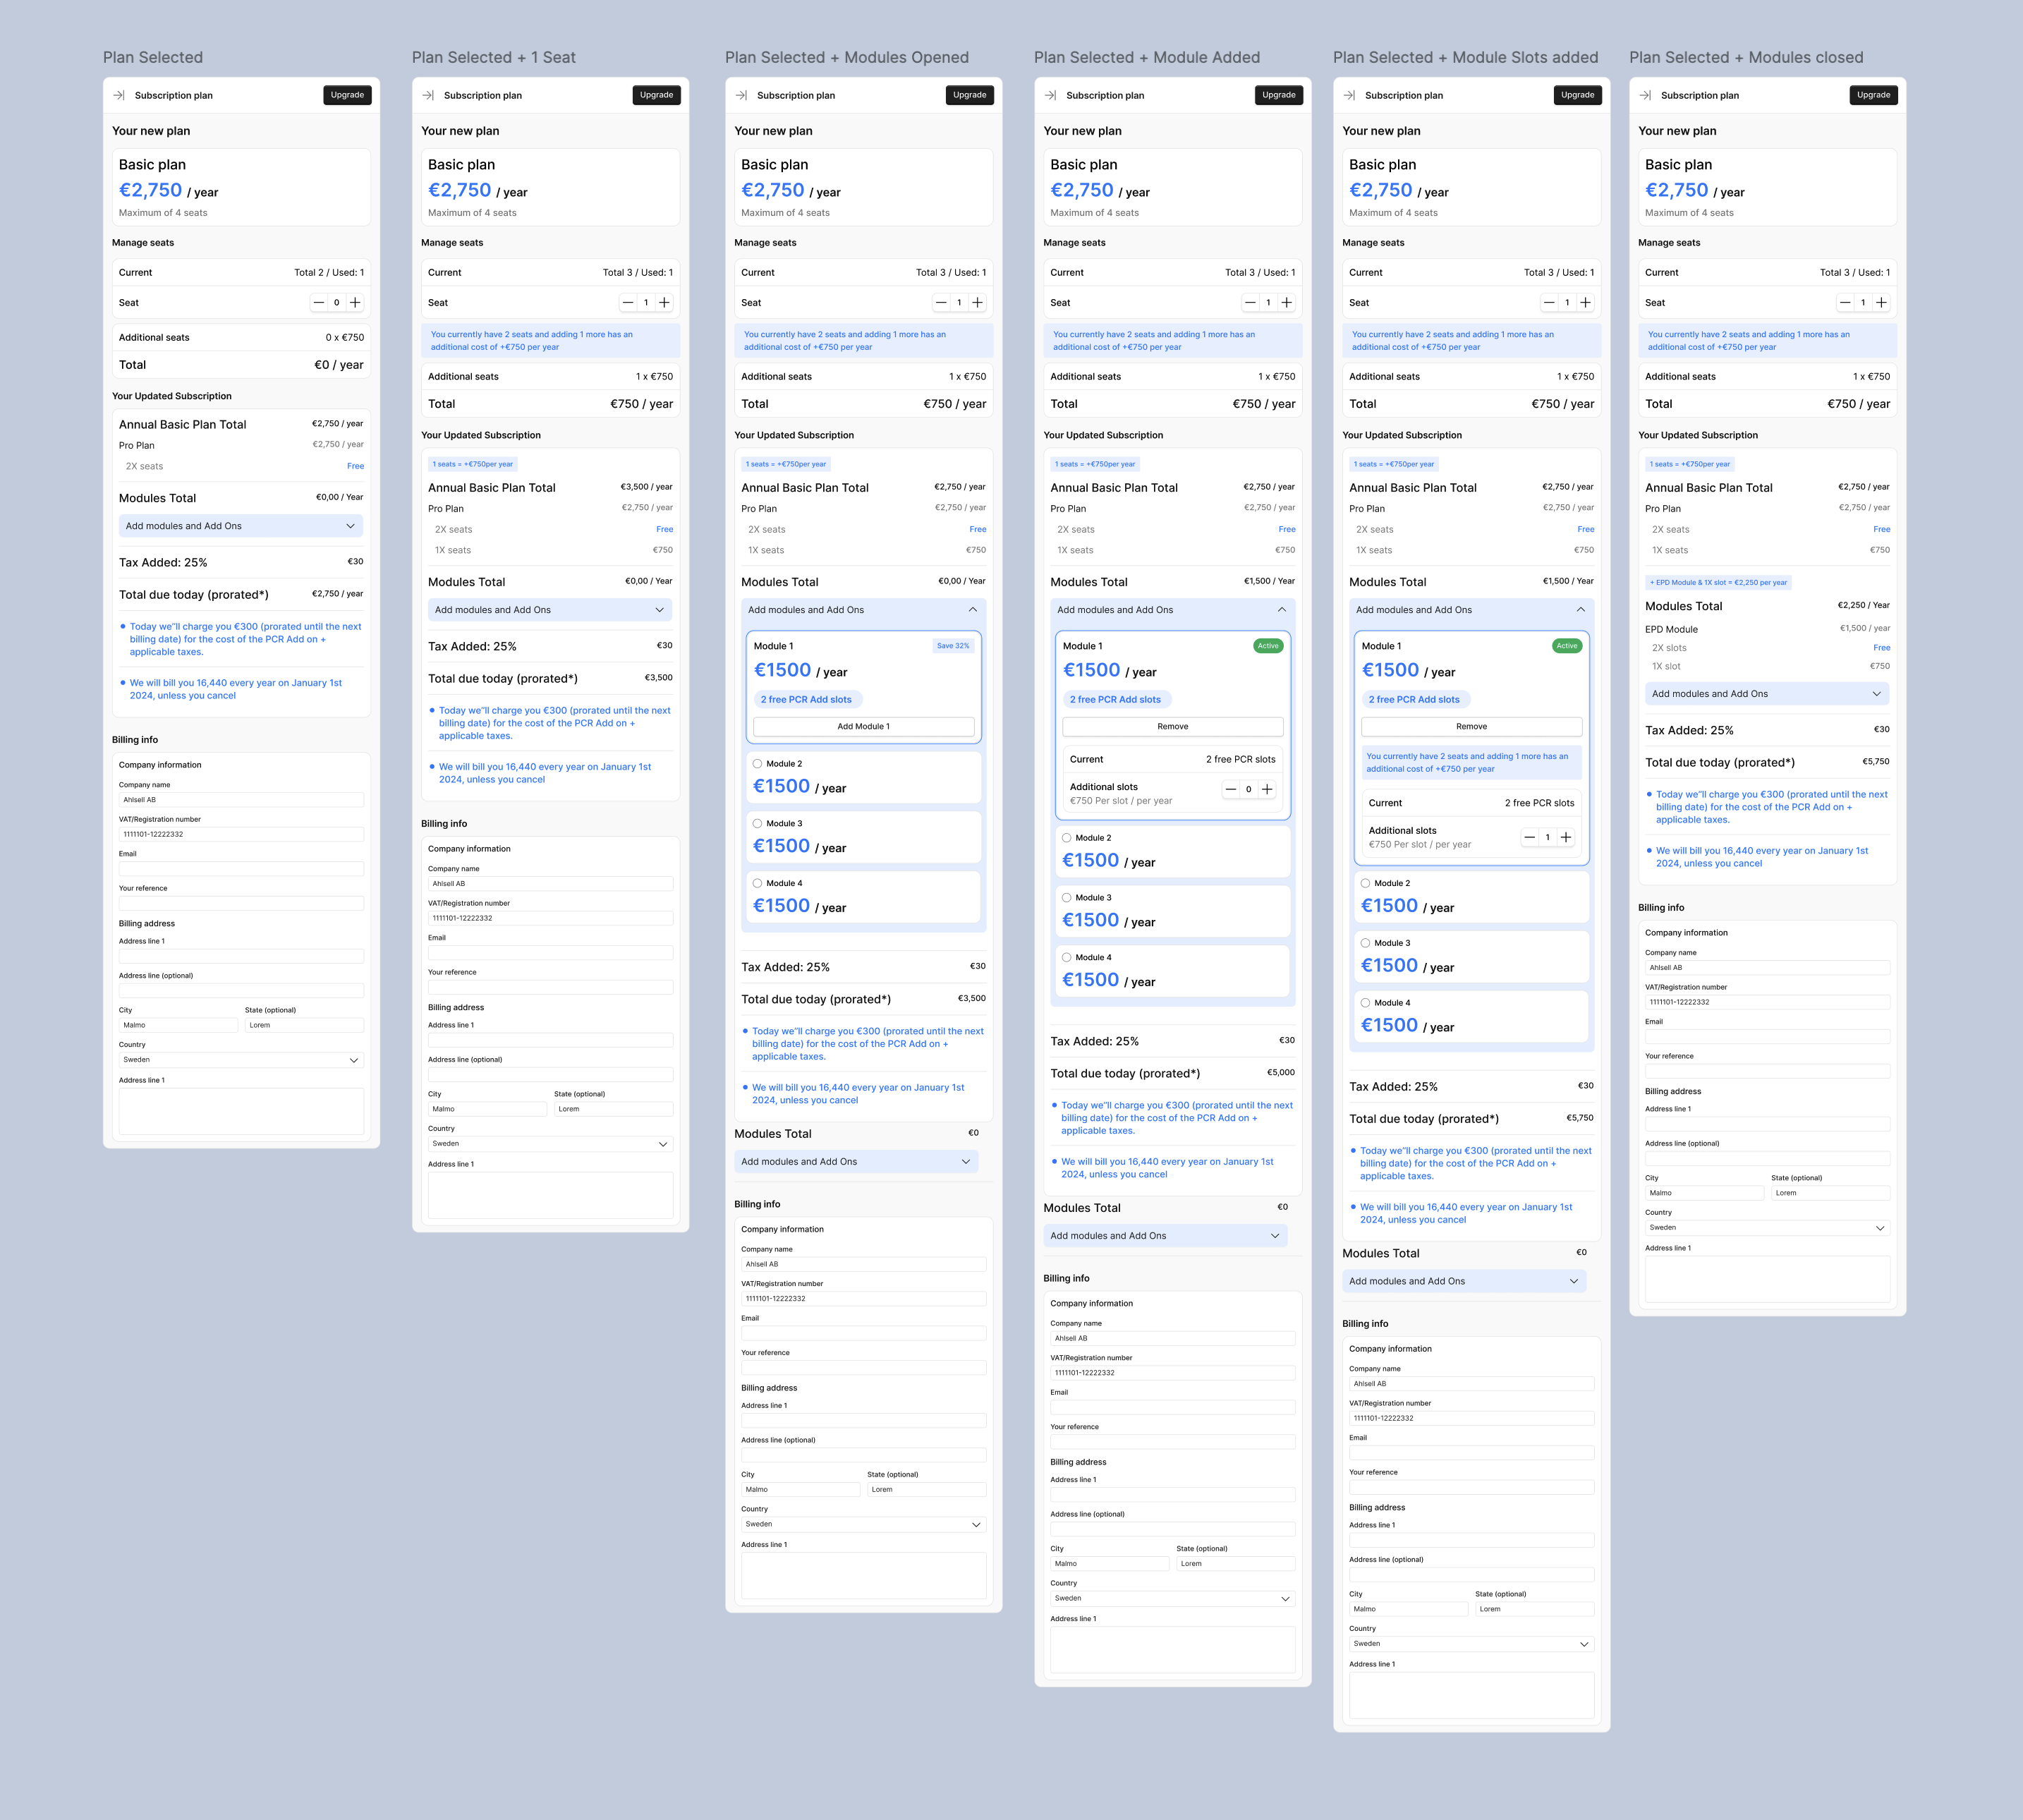
Plans
A management sidepanel for buying seats, plans, and modules
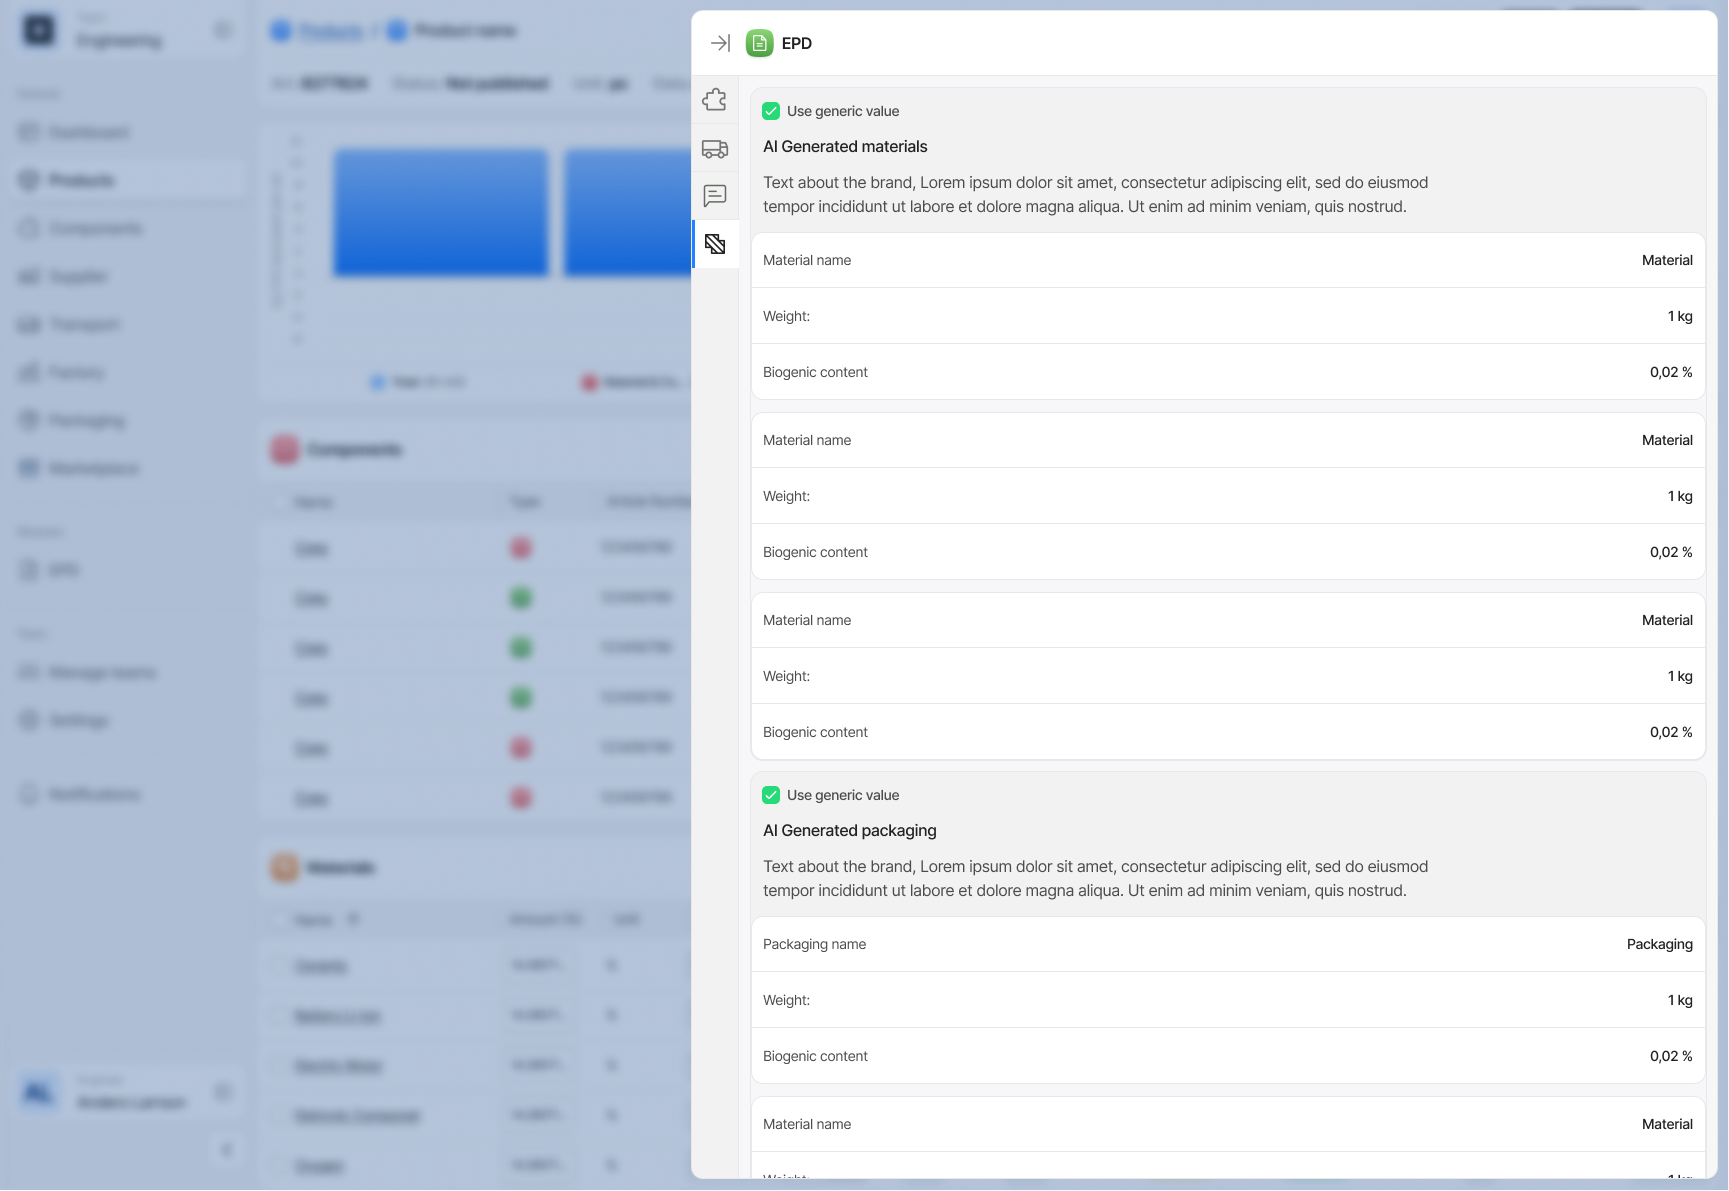
EPD
Quick access to declaration details without leaving the main workflow
6. Outcomes
The work on EandoX helped bring a complex sustainability tool from concept to launch. It also positioned the company for acquisition. EandoX was later acquired by BIMobject, a global leader in digital building products. Through this integration, the platform reached a much wider audience in the architecture, engineering, and construction sector. At the same time, BIMobject gained advanced AI-driven capabilities for sustainability reporting and Environmental Product Declarations.
This outcome validated both the product vision and the design decisions, proving that a user-friendly, scalable approach to compliance and environmental data could generate significant strategic value in the market.